
Bitcoin’s move above $80,000 is testing whether its recent departure from the S&P 500 reflects a true macro regime change, or the market’s most liquid risk switch reacting to two different clocks.
Bitcoin appears to be decoupling from the AI-driven S&P 500 in terms of direction, volatility, and stress months following the opening of the US stock market.
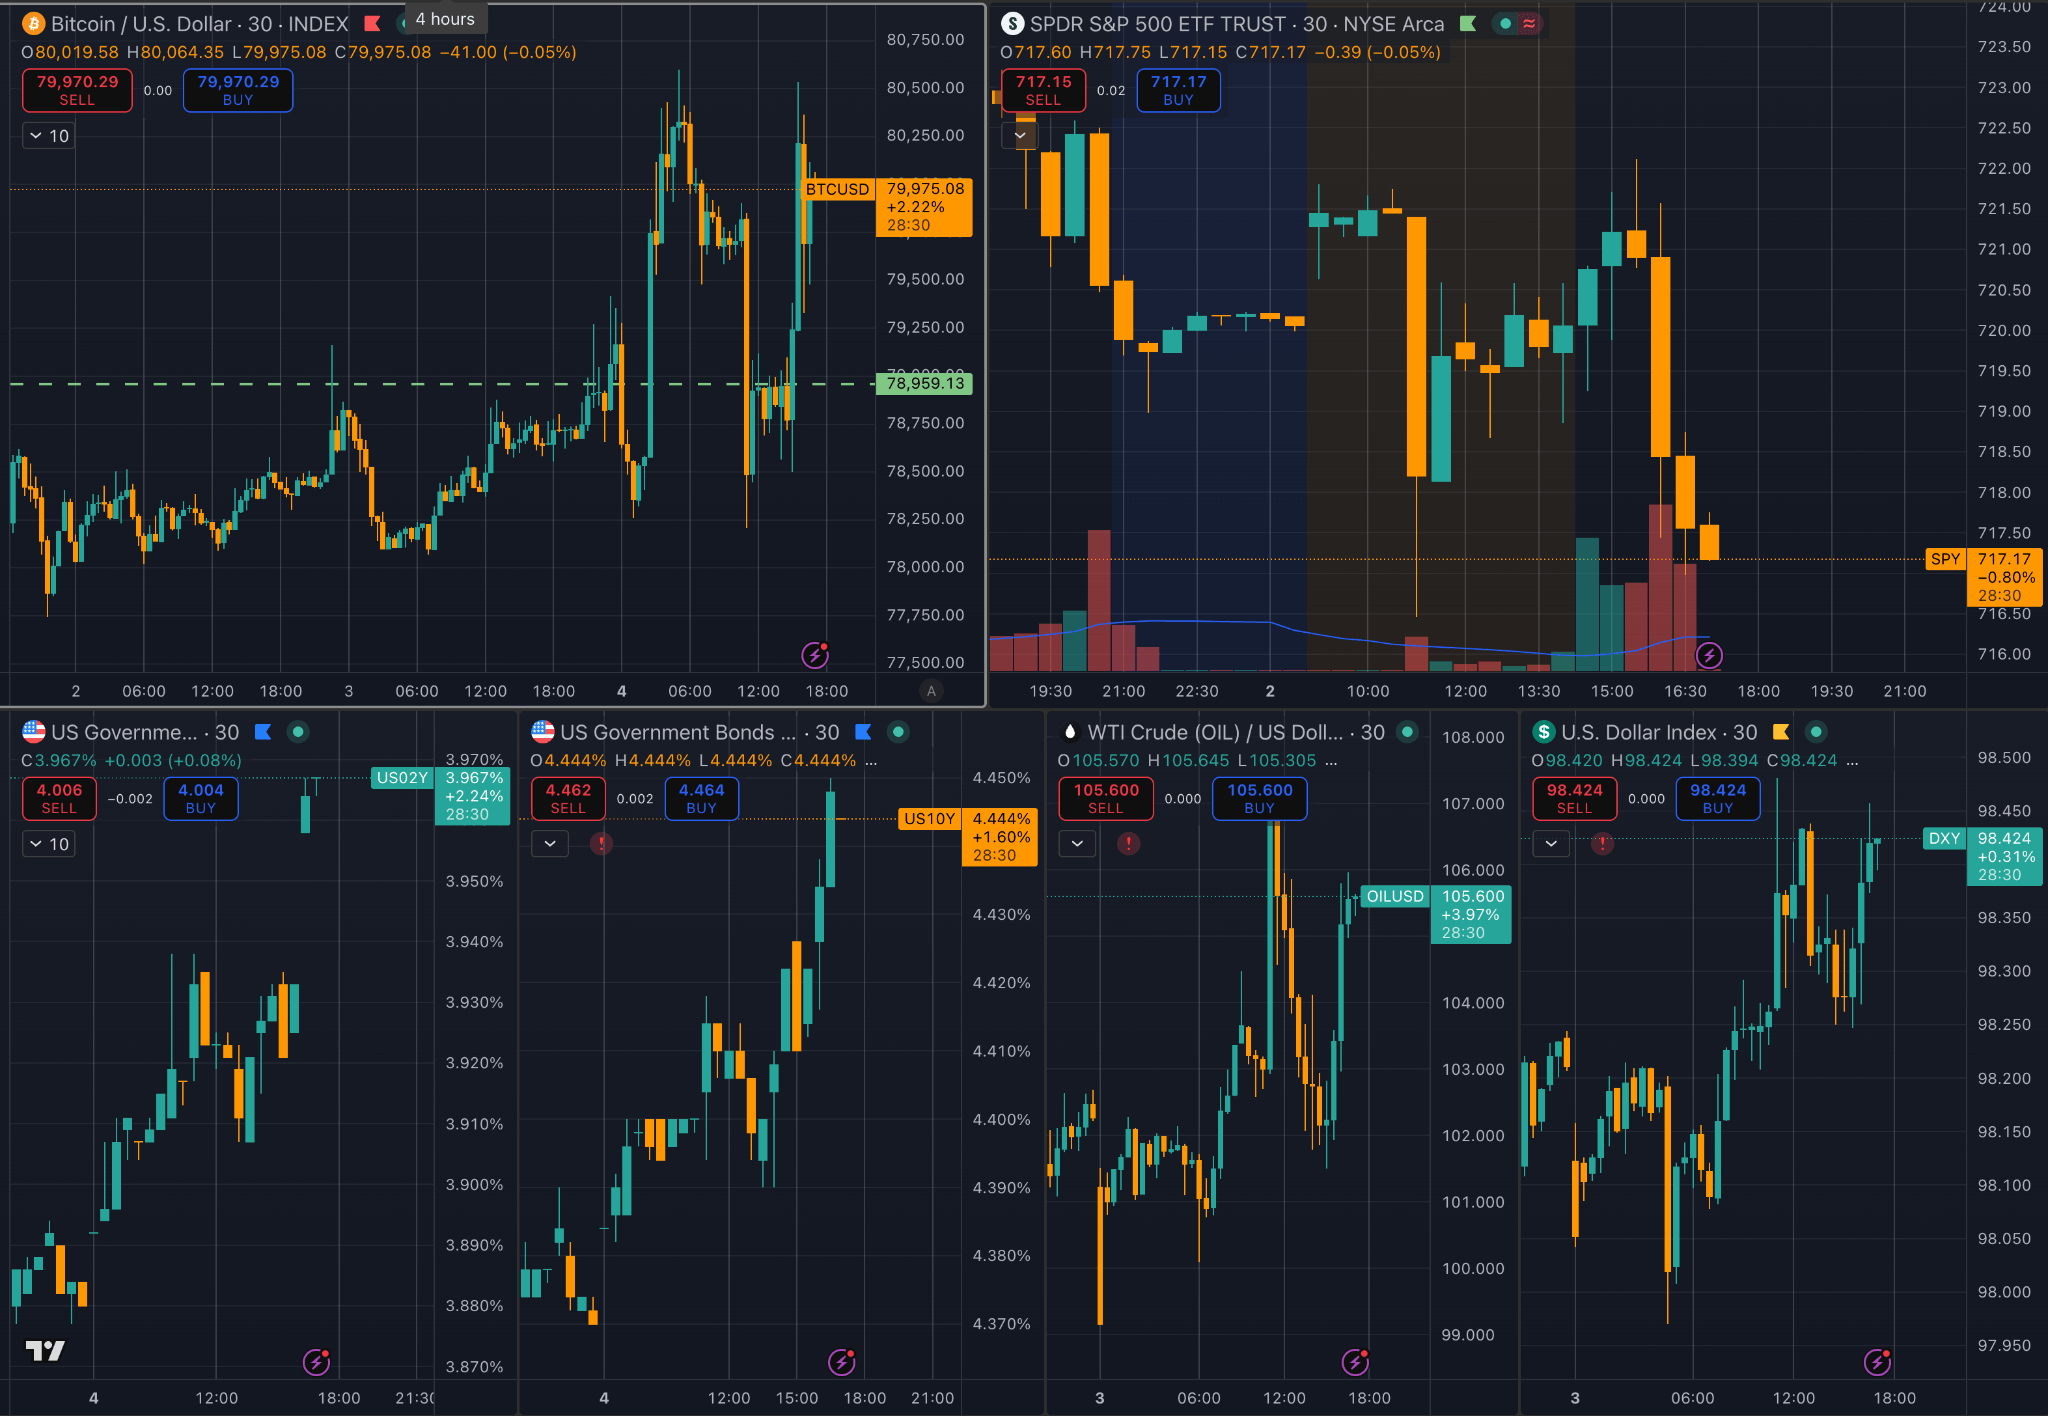
The discrepancy appeared as the usual pressure points moved against the stock. Oil prices have soared due to the recent escalation of the war with Iran. Government bond yields rose. The dollar was strong. US stocks fell from record levels.
However, Bitcoin did not follow the decline in SPY as it did during the previous oil spike and remained at around $80,000.

The data shows that the market is not a clean haven from stress, but is more complex. BTC may be currently trading at the intersection of AI-driven risk appetite, ETF-related brokerage demand, and the geopolitical oil shock that is refocusing the bond market.
The next morning, it became difficult to distill this setup into a single bullish story. Oil prices softened, U.S. futures rose slightly, and the division between assets appeared to have reversed course.
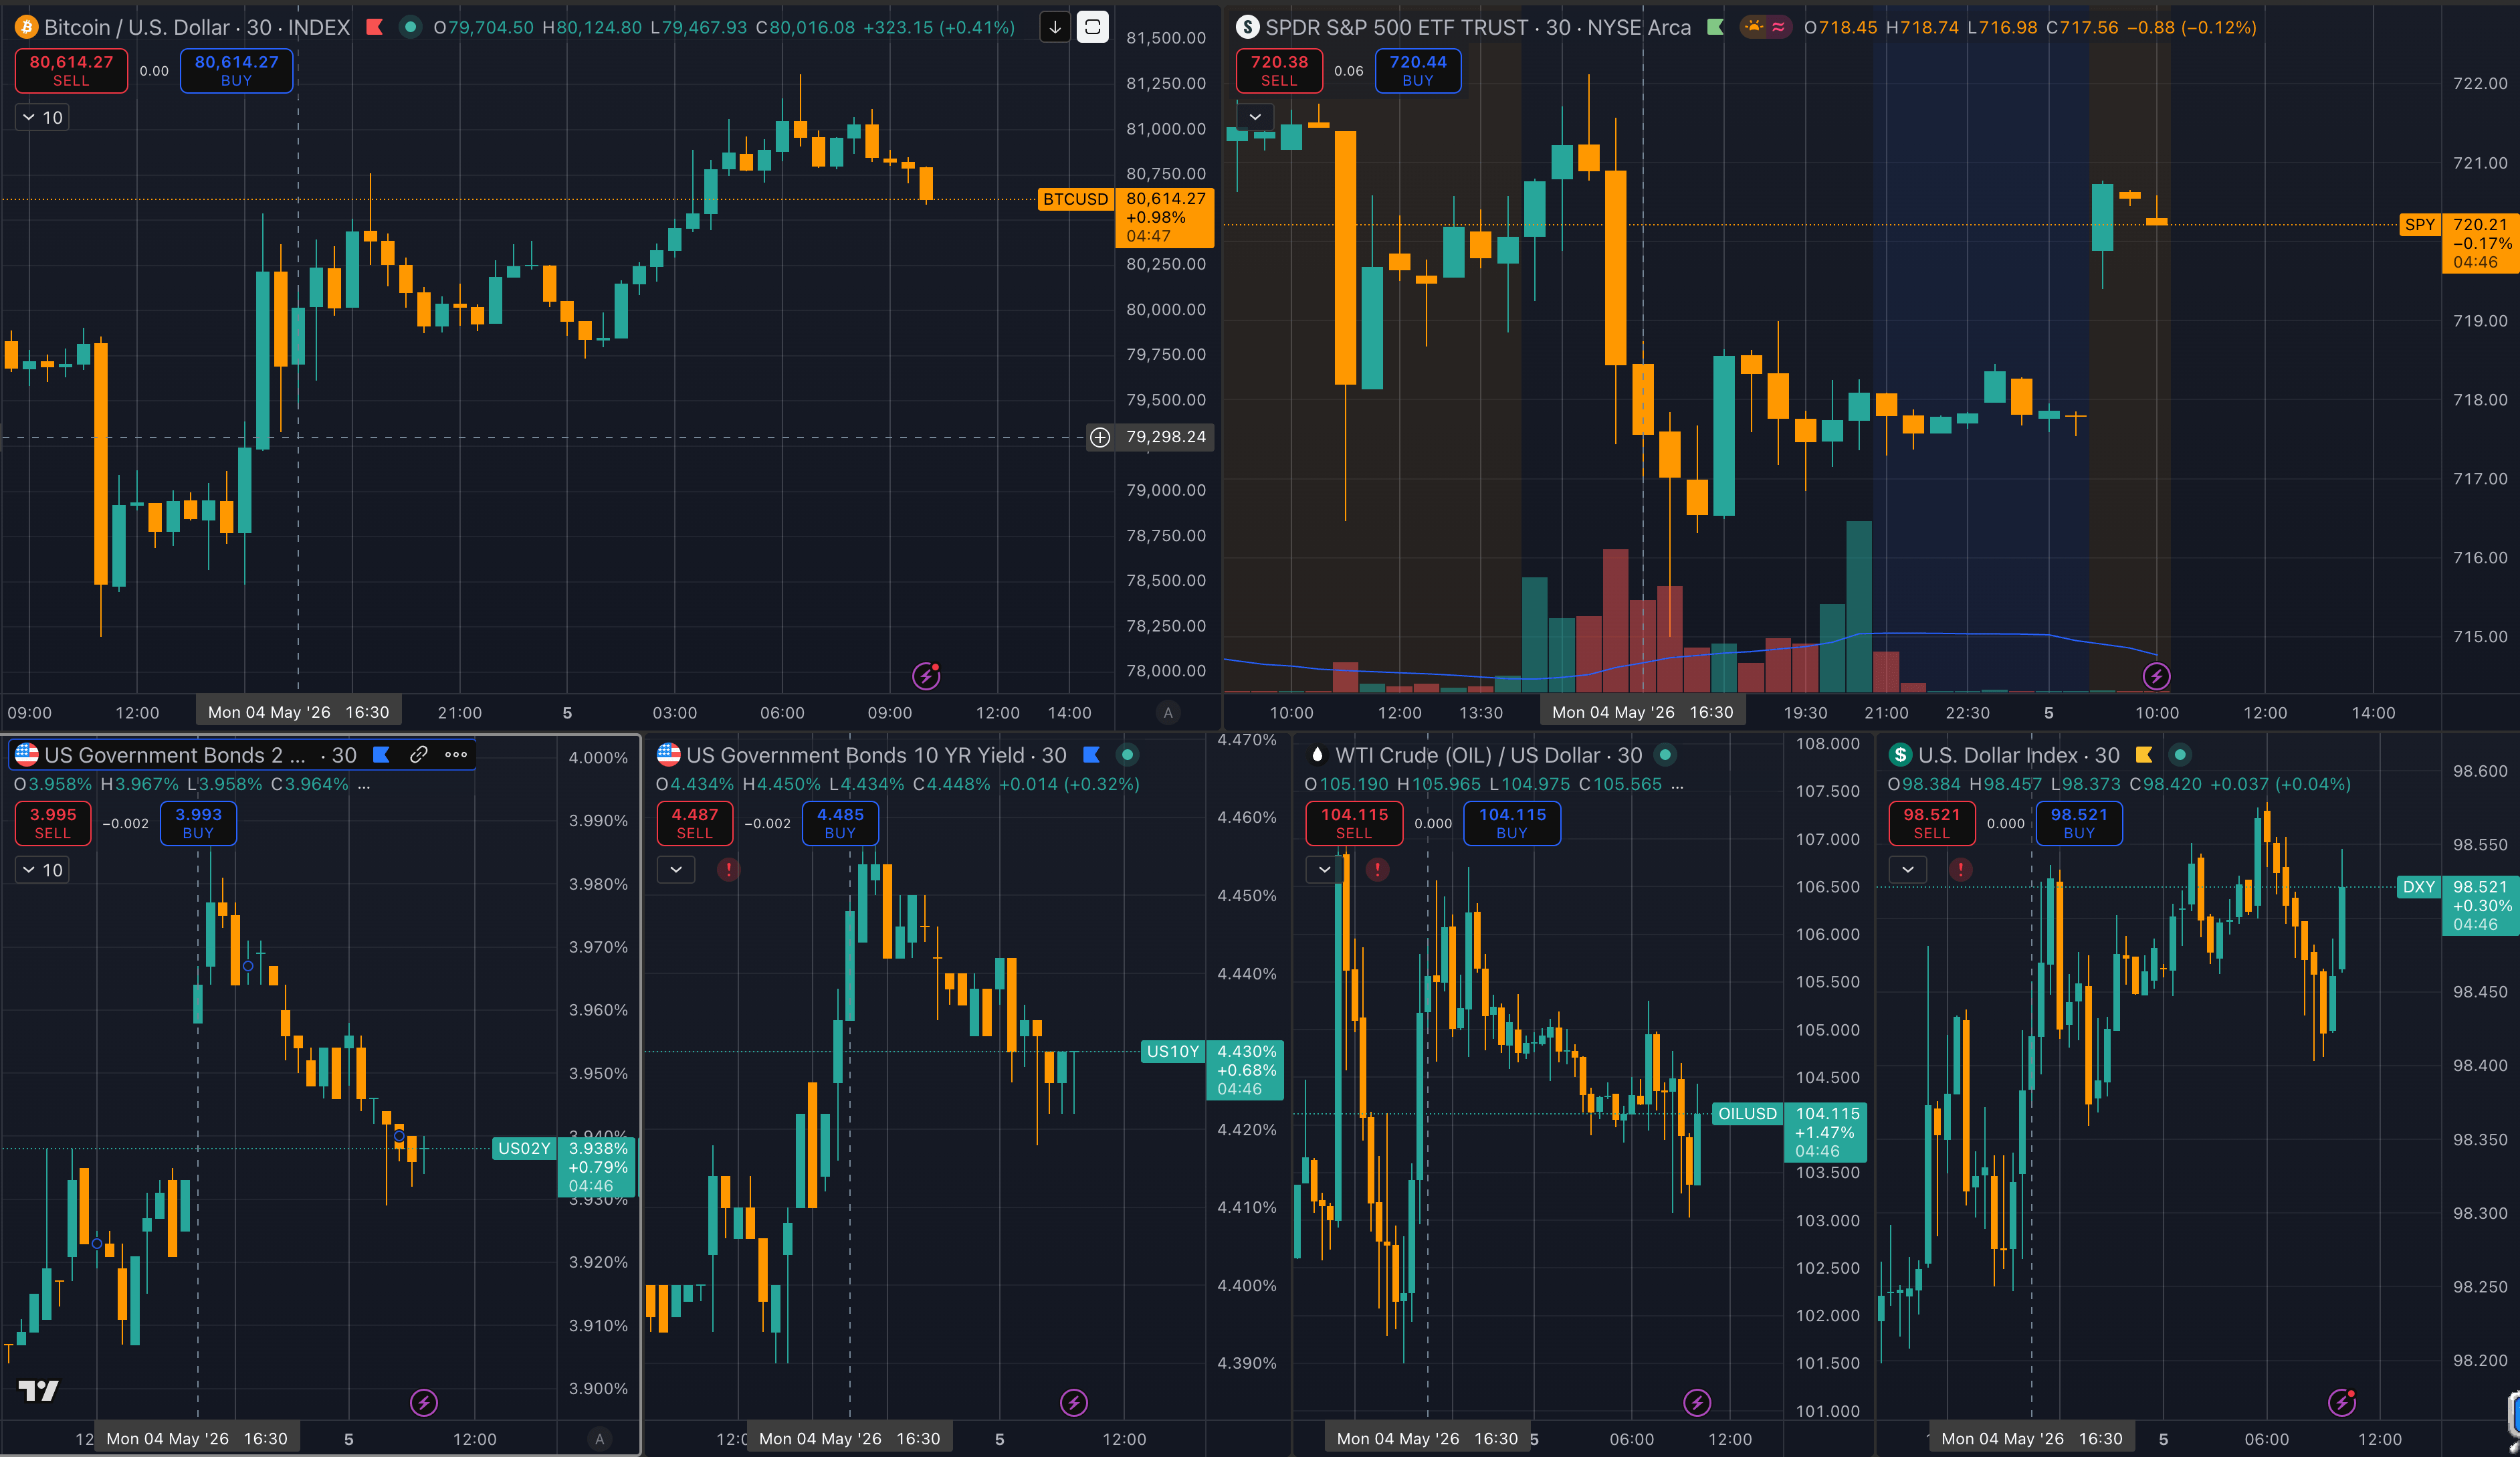
If Bitcoin could rise while SPY declines, then soften while stocks firm, the story might be less about a single correlation breaking down and more about Bitcoin reacting to different leading markets at different times of the day.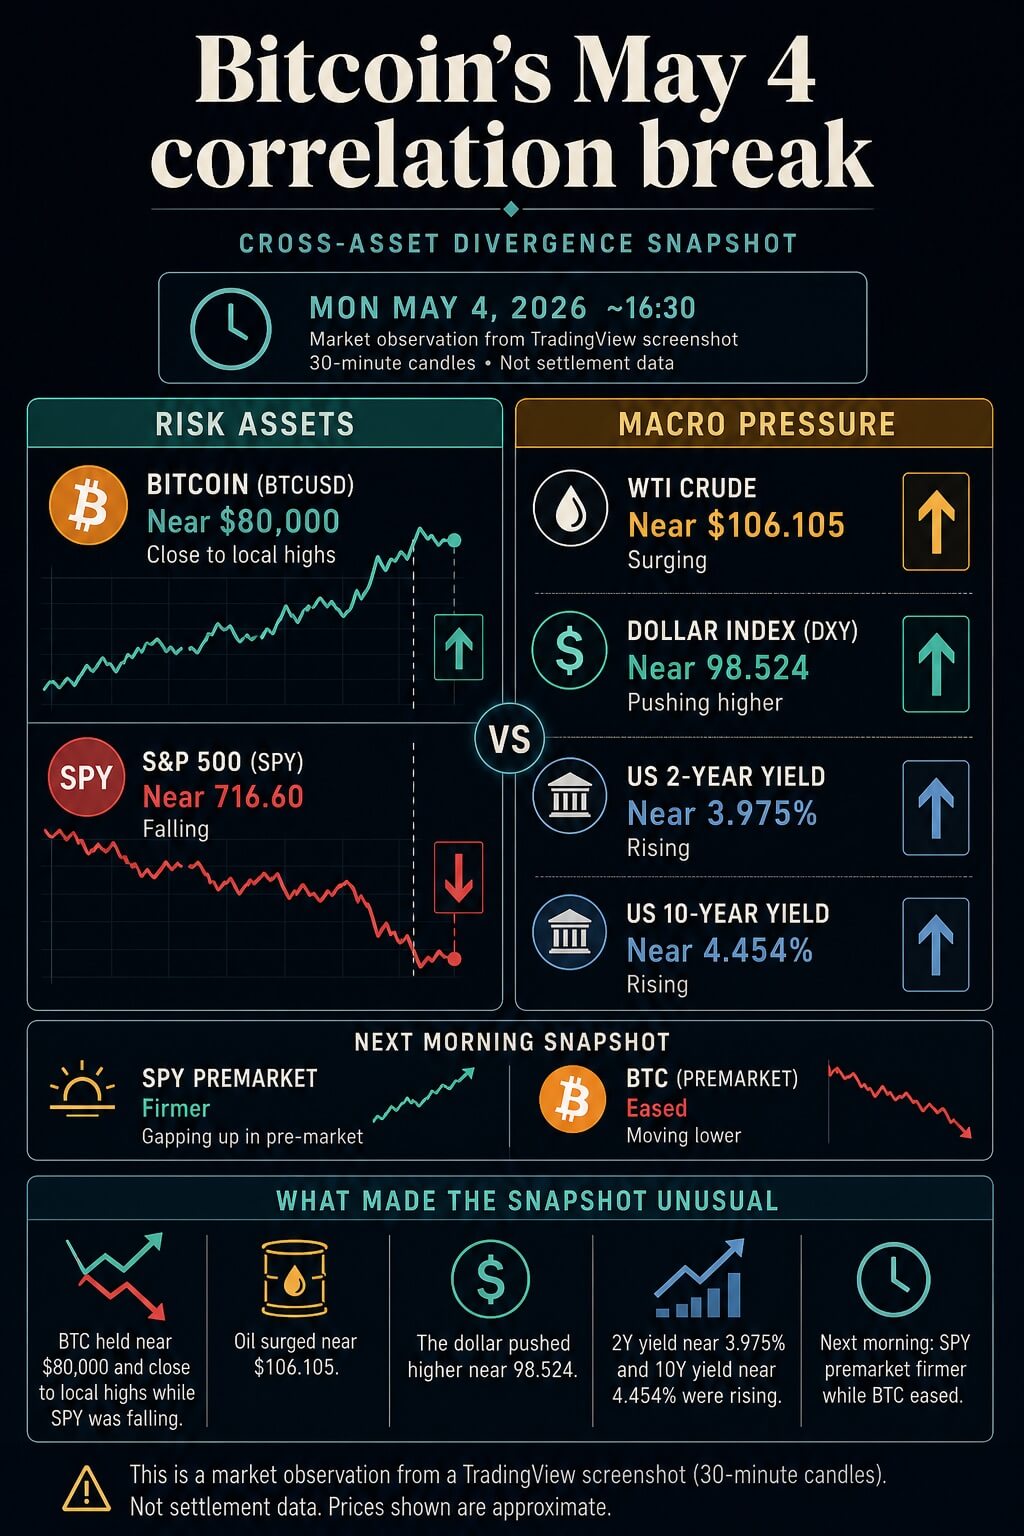
Oil shocks and the split in risk appetite
The May 4th session provided a reliable macro context for this divergence. The S&P 500 fell 0.4%, the Dow fell 1.1% and the Nasdaq fell 0.2% as Brent crude oil rose 5.8% to settle at $114.44.
The move comes as new fighting in the Middle East threatens a ceasefire with Iran and complicates U.S. efforts to reopen the Strait of Hormuz.
The state of the crypto market puts Bitcoin in a different position than stocks. Bitcoin was trading around $80,743 as of May 5, up more than 2% in 24 hours and more than 20% in 30 days.
A broader ranking table shows that there is a cryptocurrency market worth approximately $2.67 trillion, with Bitcoin’s dominance at nearly 60.6%.
These numbers set the scale. A BTC move of this magnitude is a signal for the entire market, rather than an isolated altcoin rally.
If Bitcoin stops tracking SPY during the oil and interest rate shocks, the question becomes whether there are new buyers, whether old correlations are breaking down, or whether the market is digesting different sessions in sequence.
The first explanation is appealing. crypto slate Reports have already revealed that non-cryptocurrency drivers are at play. Bitcoin’s $80,000 rally began as an Asia-led AI risk trade, with strength in chip and regional stocks setting the tone before US trading added oil, dollar and yield pressure.

Interpretation changes depending on this order. Bitcoin had an impulse driven by technology risk appetite and an impulse driven by geopolitical price realignment.
The visible break from SPY may have emerged not because BTC explicitly rejected the logic of the stock market, but because those impulses overlapped.
This also explains why the morning reversal is part of the story rather than a contradiction to be ignored. If BTC declines after the oil cools, while US futures firm up, the market would be signaling that the amount of Bitcoin upfront may have changed.
The same chart can show a broken correlation in one window and a different pressure channel in the next window.
Oil Channel turns one chart into a macro test
The Strait of Hormuz is large enough to make chart patterns a global macro issue. Approximately 20.9 million barrels per day passed through the strait in the first half of 2025, representing about 20% of the world’s liquid oil consumption and a quarter of the oil traded by sea.
This is why the current market reaction extends beyond crude oil. As Hormuz turmoil continues, expected fuel prices, inflation, central bank flexibility, and the relative attractiveness of cash and bonds will change.
The way risk assets are valued will also change.

The current impact is already big enough to change the macro map. The World Bank predicted that energy prices would rise 24% in 2026, calling the disruption the biggest oil supply shock in history.
The April Commodity Outlook added a range of scenarios in which Brent prices could average between $95 and $115 this year if the Middle East turmoil proves to be more severe or sustained than expected.
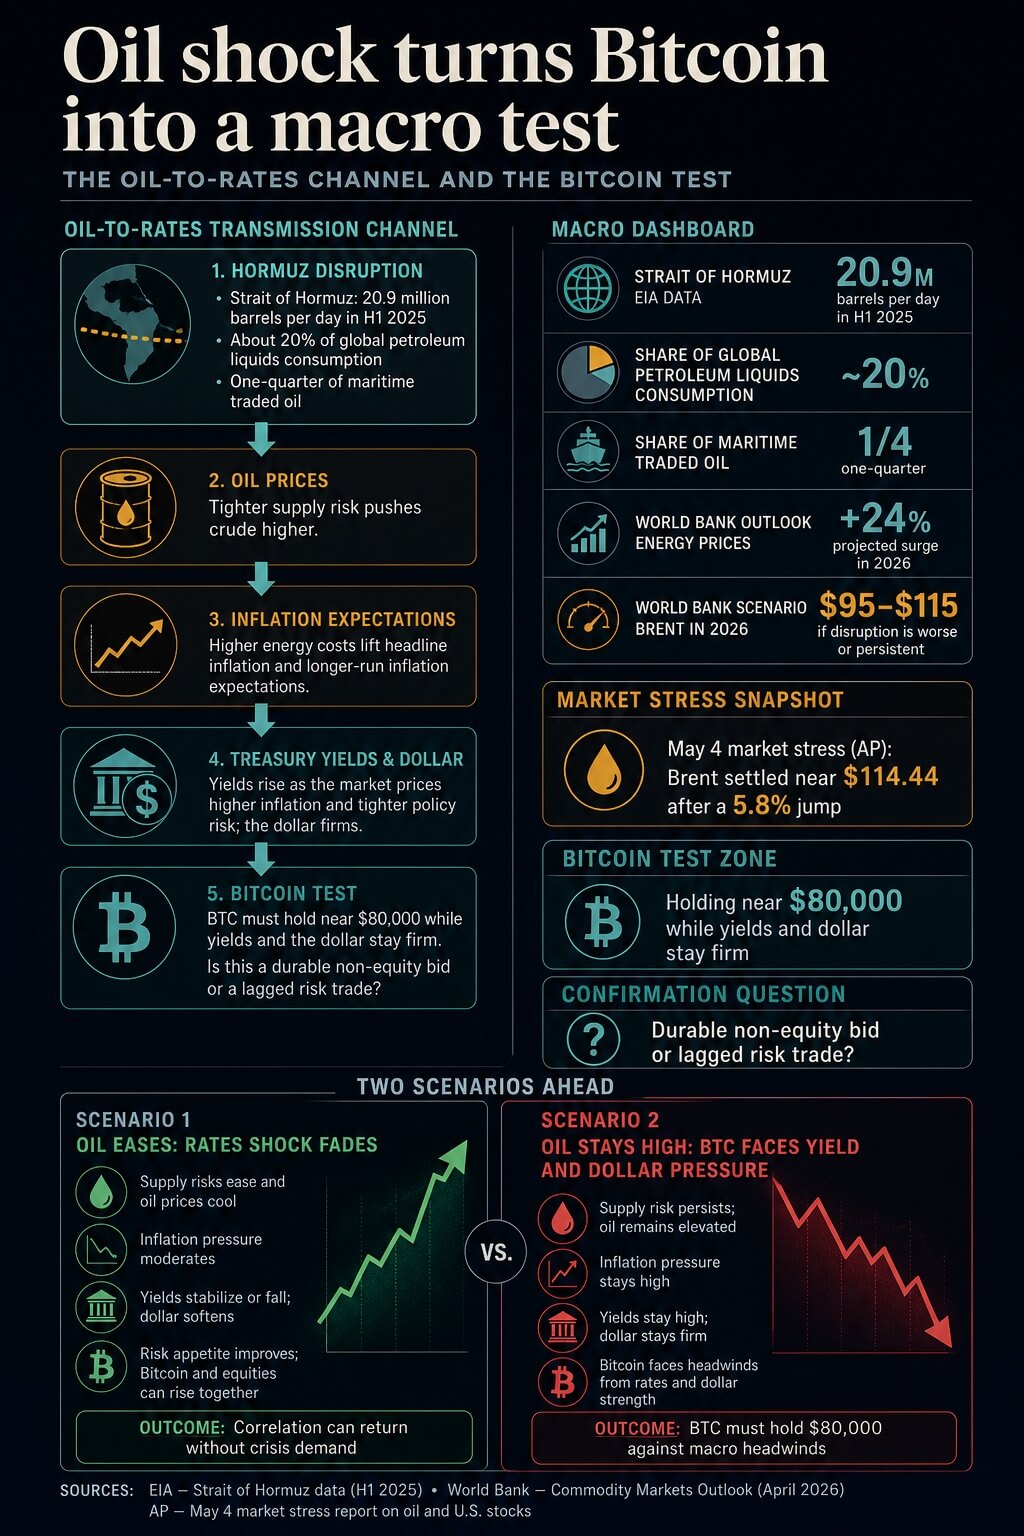
In the case of Bitcoin, there are two very different interpretations of the same price movement. Holding $80,000 while oil prices and yields are rising could suggest a more durable macro bid.
It could also reflect a lag with Asia-led risk appetite still supporting BTC before the US interest rate channel fully recovers.
The same oil shock can have opposite BTC outcomes depending on which transmission line is dominant. If investors treat Bitcoin as a liquid vehicle to express their fears of financial instability, Bitcoin could be bid up amid inflation fears.
Higher yields and a stronger dollar could have a negative impact if investors treat it as a high-beta asset competing with cash and Treasuries.
Previous crypto slate The analysis framed Bitcoin as a quick market for re-pricing geopolitical risks, especially when headlines change the direction of oil, inflation, interest rates, and liquidity expectations.
This frame still fits, but May 4th raises the bar. The previous pattern was simple. Escalation has hurt, de-escalation has helped.
This time, BTC held up despite some escalation-related inputs moving in the wrong direction for risk assets.
The second clock will go in there. Asia-led AI trading gave Bitcoin a risk-on impulse before US macro trading took over.
The ETF wrapper and public market BTC exposure also mean that brokerage account demand could move Bitcoin along the same portfolio screen that moves AI stocks. At the same time, the oil shock means bond traders are drawing BTC into the inflation and interest rate debate.
During the Asian and European trading hours today, May 5th, BTC remained around $81,000, while US Treasury yields and the dollar rose on the back of higher oil prices, and higher Asian tips were part of the risk backdrop.
The result is a market that relies on external inputs yet appears uncorrelated in a single snapshot.
Bitcoin may initially follow another led market and then catch up to the next macro impulse.

| signal | Impact on BTC | What supports the break |
|---|---|---|
| Oil remains above stress levels | Pressures shift from geopolitics to inflation and interest rates | BTC remains strong despite strong yields and dollar |
| Oil prices drop due to progress in Hormuz | Interest rate shocks may fade and risk appetite may strengthen again | BTC and stocks rise together without the need for crisis demand |
| AI and chip stocks continue to lead | BTC may be traded as a risk asset in brokerage accounts | BTC follows technology strength even when macro headlines are noisy |
| ETF flows and derivatives are weak | This move may be primarily for positioning rather than sustained demand | BTC loses $80,000 territory due to resurgence of macro pressures |
The following signals will originate from multiple markets
The geopolitical problem remains in Hormuz. The U.S. attempt to force the strait open would test a fragile May 5 ceasefire, with Iran warning of the move and the U.S. announcing two U.S.-flagged commercial ships had passed.
If these efforts are successful and transportation returns to normal, the pressure on oil pressure should ease. This would cushion interest rate shocks and allow Bitcoin to trade more cleanly based on ETF demand, technology risk appetite, and the $80,000 level itself.
If the reopening fails or the retaliation escalates, an even tougher test begins. Bitcoin will have to withstand a more persistent combination of rising oil prices, a strong dollar, and rising U.S. Treasury yields.
That would be strong evidence that BTC received non-equity bids, but evidence would still need to be confirmed from ETF flows, derivative positioning, and sustained price acceptance above the low $80,000 region.
Correlation destruction is important because it suggests that BTC holders can be exposed to multiple macro engines simultaneously.
In a single session, Bitcoin can behave like a technology risk asset. In another example, it could act like the fastest market for repricing war risks.
Third, there may be a pull back into the calculations of the bond market, which still dominates liquid assets.
That is the true test of the system. Bitcoin’s equity link is becoming imperfect as oil, AI stocks, ETF wrappers, the dollar, and US Treasury yields all compete to decide the next move.
(Tag Translation) Bitcoin