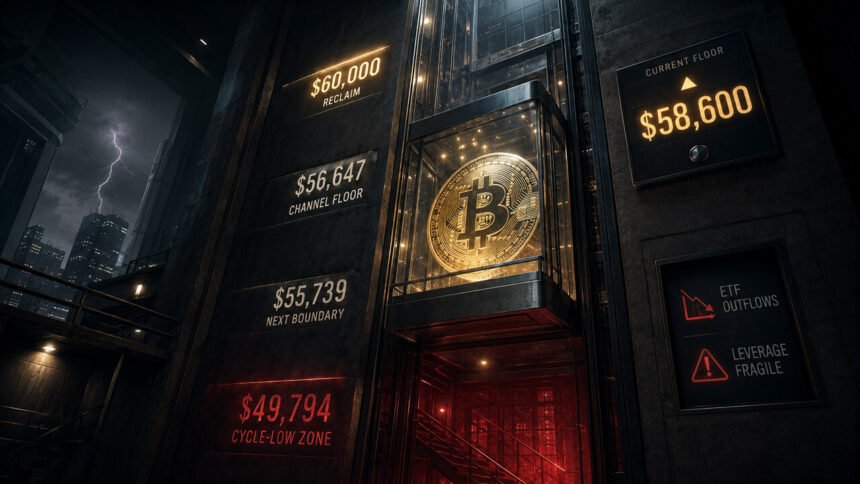
With Bitcoin falling to the low $50,000s, my $49,000 cycle low map is back in the live market conversation.
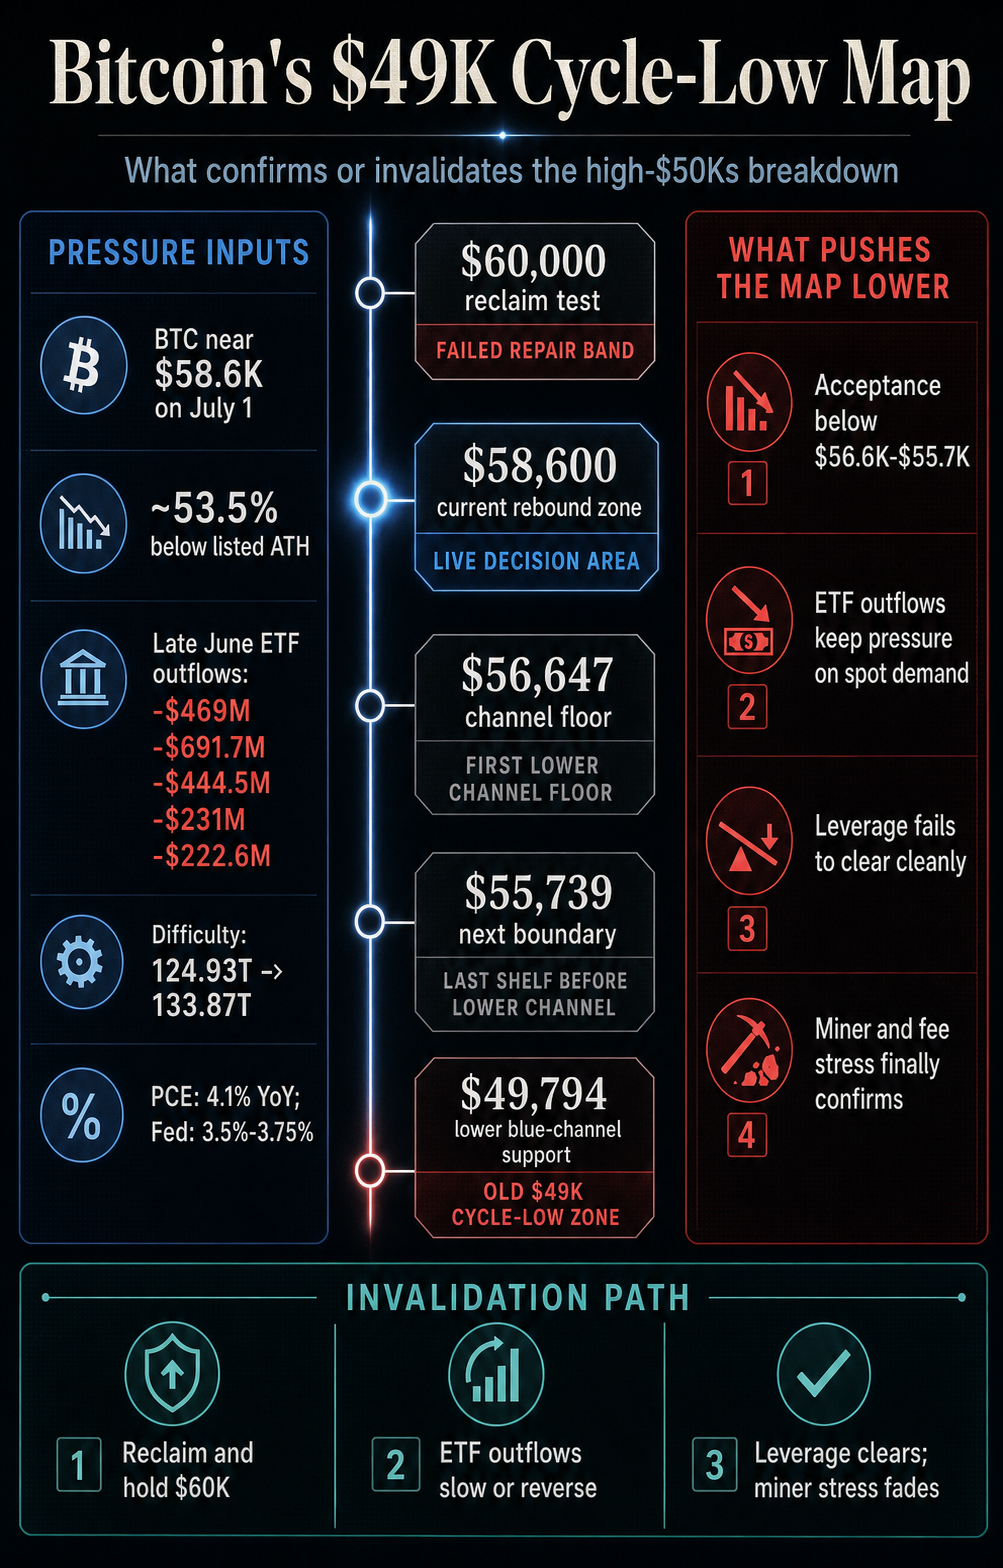
According to Bitcoin market data from firememecoins, BTC was trading around $58,600 as of July 1, down more than 19% in 30 days and about 53.5% below its all-time high of $126,198.
Market capitalization $1.17 trillion
24 hour volume $33.45 billion
Best ever $126,198.07
BTC printed around $60,000 from June 26th to June 29th, but fell to $57,735 during Asian trading hours at the beginning of July 1st.
This leaves the price close enough to my lower channel level for the old framework to move from background risk to active decision maps.
The $49,000 path requires acceptance below the low $50,000s and requires confirmation from the same stress stack I used in my original paper: weak ETF demand, weak leverage, miner pressure, and limited spot absorption.

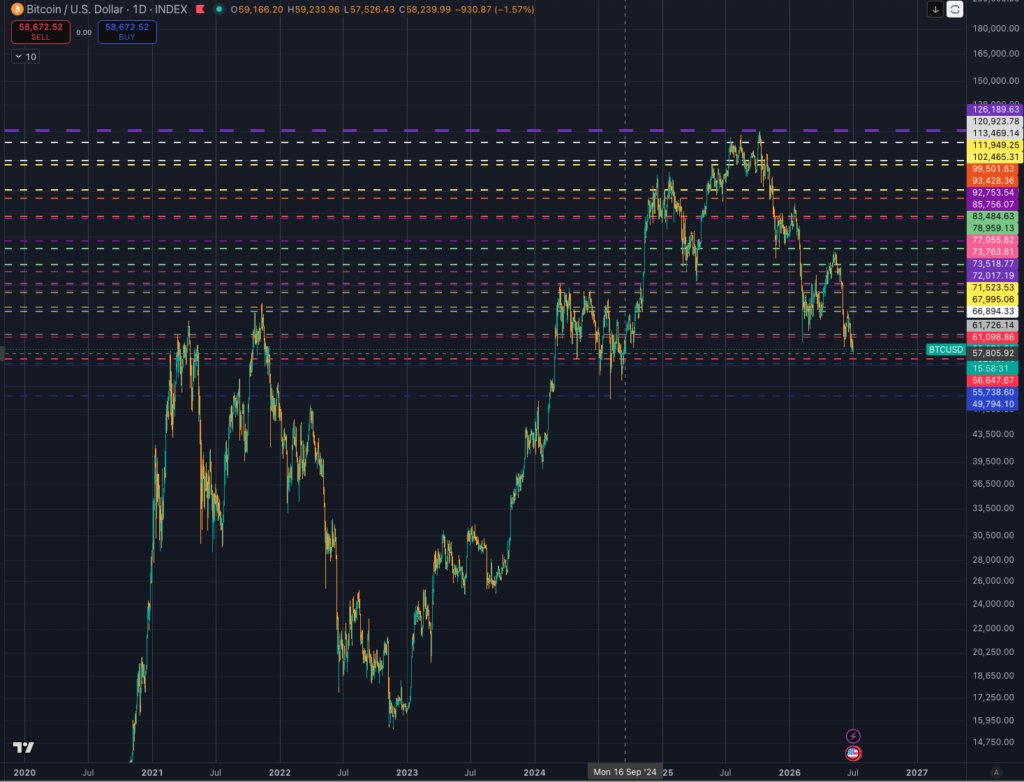
On my current BTCUSD daily chart, the first lower channel bottom is near $56,647, the next boundary is near $55,739, and the lower blue channel support is near $49,794.
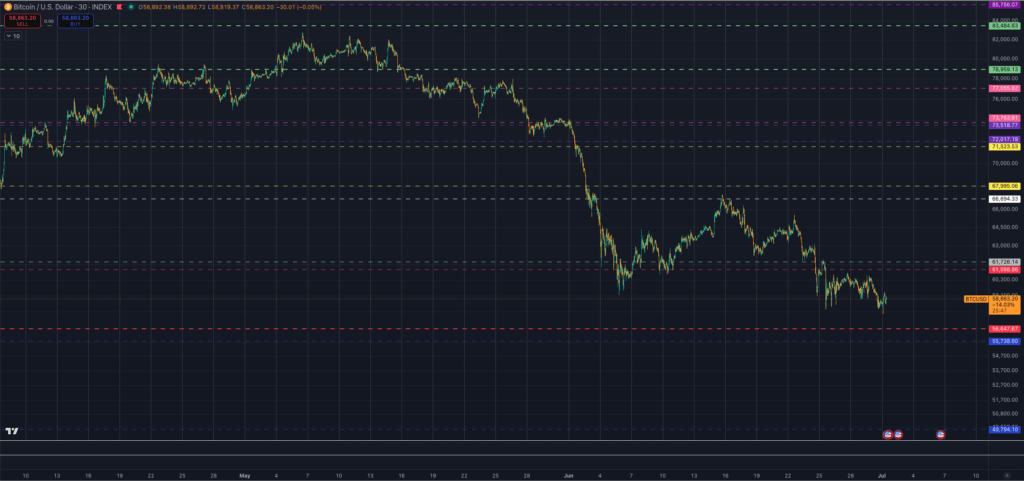
After a new low in the $57,500-57,800 region and a rally to $58,200-58,600, Bitcoin is close enough to that level that the framework now needs to be tested with real demand.
Why the $49,000 map is back
When I first presented my Bitcoin medium-term bear thesis, $49,000 was the base case for a cycle clearing built on multiple conditions lining up at once.
The combination was a weakening miner economy, weaker fee shares, increased hash price pressure, less elastic ETF flows, lower leveraged liquidations, and spot demand arriving too slowly to absorb the movement.
The thesis was always conditional. If fees are recovered, ETF demand remains resilient, and the forced sell-off ends before the market loses its higher support shelf, the low could move above $49,000.
If these inputs had deteriorated together, the high $40,000s would have been the zone where the cycle would have to break out.
The same logic was followed in my January update and February follow-up. At that time, the price was not in the target zone, but plumbing was already a noteworthy part.
With each failed repair level, the same test of whether buyers could prove demand before deeper cycle inputs worsened became clearer.
With the July holidays, that challenge will once again appear before the market. A recent report from firememecoins already has BTC near $58,000, above the channel level I’m keeping an eye on. We addressed the exhaustion-or-acceptance issue around $58,000, IBIT sellwall risk, the $60,000 derivative setup, and the 200-week moving average. break.


The $49,000 map connects these signals into a single decision-making framework.
For me, the distinction is between location and proof. A price tag of nearly $58,000 makes the map more relevant. Evidence is obtained if it is accepted below the next two channel boundaries.
This maintains an analysis based on behavior throughout the session, including whether buyers intervene before $56,600, whether flows stabilize by the next ledge, and whether the market can maintain repair levels after deleveraging.
The bottom blue channel will remain the risk zone until these inputs are aligned. And that will be the area where the cycle law thesis faces the most direct test.
$49,794 Previous Test
My June channel map work was built around being accepted across sessions rather than single candles. The same rules apply here.
Even if you put the wick in the bottom channel, it can flip quickly. I want to know where Bitcoin will accept transactions, where sellers will stop paying, and where spot demand will emerge if the market tests the next shelf.
| level or zone | role of market | what would confirm that? | what weakens it |
|---|---|---|---|
| Low $50,000 to $60,000 | failed repair band | BTC remains locked near $58,000 after repeated rejections and closes below $60,000 | $60,000 Recharge that is retained for the entire session |
| $56,647 | Lower limit of current channel on my chart | Anything below that is acceptable as ETF outflows and leverage pressures still exist. | Rapid recovery to the low $50,000 range |
| $55,739 | Next border before bottom blue channel | Price that treats the previous floor as resistance | Strong spot demand absorbs the break |
| $49,794 | Lower Blue Channel Support and Old $49,000 Cycle Low Zone | Mid-$50,000 losses continue as paper input continues to deteriorate | ETF flows are stable, leverage is liquidating cleanly, and no minor stress has been identified. |
These levels act as decision zones. The market may break through a certain level during the day but reject the breakdown.
It is also likely to remain at that level for a day or two while the underlying flow conditions continue to deteriorate. The key test is acceptance.
The ETF side has moved in the direction that the old paper warned about. The Pharcyde Bitcoin ETF table shows repeated negative daily totals in late June, with outflows of $469 million on June 24, $691.7 million on June 25, $444.5 million on June 26, $231 million on June 29, and $222.6 million on June 30.
While ETF flow pressure is just one input, the current flow record has yet to show a steady demand response that would push the $49,000 path back to the edge of the map.

IBIT adds context regarding holder pressure. According to BlackRock’s iShares Bitcoin Trust ETF page, it has approximately $43.23 billion in net assets, a NAV of $33.19 at the bottom of its 52-week range, and a year-to-date NAV return of 31.08% as of late June.
This supports the idea that while ETF-era exposures are under pressure, individual cell wall structures are better served through firememecoins’s IBIT flow coverage.
Leverage could still accelerate the next break. CoinGlass provided background on live futures trading, and firememecoins’s coverage of the June 25 long liquidation flash showed how quickly the market can reverse when the round number repair level fails.
The current setup should be understood as a form of conditional leverage vulnerability. If the positioning remains exposed and there is a break from $56,600 to $55,700, the move to the lower channel could feed on itself.
Macros add another constraint. The U.S. Bureau of Economic Analysis reported that the headline PCE inflation rate rose 4.1% in May compared to the same month last year, and the Federal Reserve kept its policy rate unchanged at 3.5% to 3.75%, noting that inflation remained high relative to target.
This background limits the rescue narrative, even though BTC has already failed to recover $60,000.
Minor confirmation remains an outstanding leg. My original paper relied heavily on minor economics, fee shares, hash prices, and forced stress.
According to CoinWarz difficulty data, Bitcoin’s difficulty increased by about 7.15% in seven days, from about 124.93 trillion on June 26 to about 133.87 trillion on July 1.
The difficulty leaves the hash price and fee income unresolved, thus acting as a counterweight to the claim that the mining leg of the $49,000 paper is fully activated.
That’s balance. ETF flows and price structures are trending toward dogma. Use leverage to accelerate your next break. Macros are constraints. Miner’s surrender still requires confirmation.

What disables a $49,000 pass?
A clean disable is easy. Bitcoin needs to regain the upper half of $50,000 and then maintain the $60,000 level based on real demand.
ETF outflows need to slow or reverse. Leveraging must be unwound without a new downside cascade. You need to check the stress of miners and fees.
If that happens, the $49,000 map reverts to a risk scenario rather than an actual framework.
The market will say that the low $50,000s is the level of exhaust low that buyers are looking for, not an inventory before the lower channels are tested.
If the opposite happens, the map becomes more important. Acceptance below $56,647 would cause the current channel lower bound to retreat relative to the market.
Once accepted below $55,739, the next boundary will begin to turn into resistance. If it happens while ETF outflows continue, leverage remains vulnerable, and the miner economy ultimately deteriorates, the $49,794 support becomes a real cycle test rather than a distant line on the old chart.
My $49,000 cycle low theory is back on the table. Because Bitcoin is close enough to the lower channel where the framework guides the next decision.
Confidence comes from being accepted for less than mid-$50,000 and the stress that continues to accumulate. The invalidation stems from the demand to recover $60,000 and the high $50,000 proving to be a liquidation low rather than the next shelf.
(Tag translation) Bitcoin