
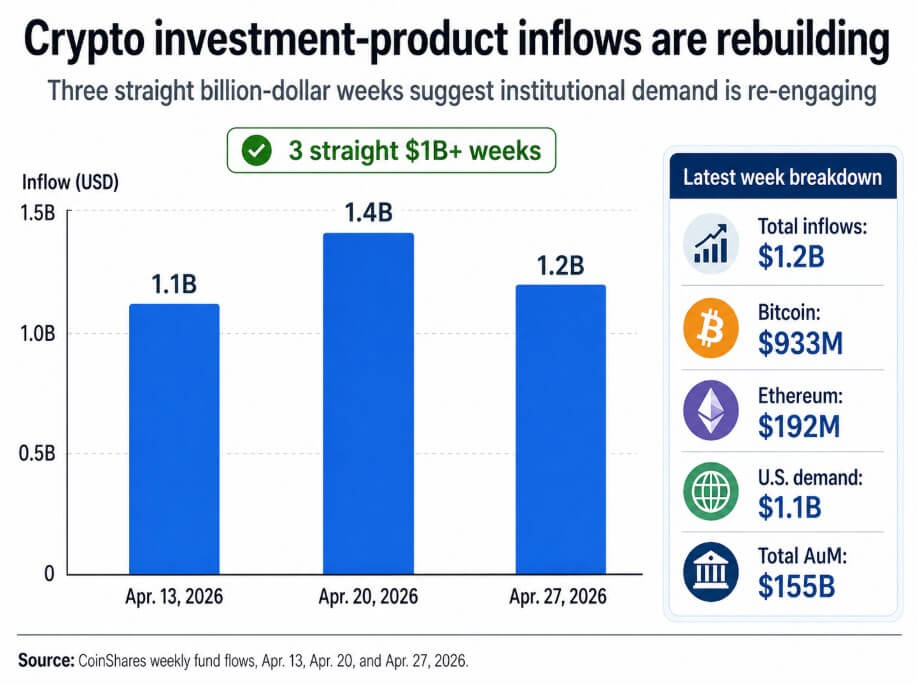
Last week, inflows into crypto investment products hit $1.2 billion, the third consecutive week above $1 billion and the fourth consecutive week of positive inflows.
Bitcoin pulled out $933 million of that total, Ethereum added $192 million, and the U.S. accounted for $1.1 billion of regional demand, according to CoinShares data. Total assets under management rose to $155 billion, the highest since February 1, but still below the October 2025 peak of $263 billion.
While CoinShares cautioned the April 28-29 FOMC decision as a slight cause for alarm, it attributed the third consecutive week of gains to improved demand from institutional investors.
demand stack
The inflow data converges simultaneously with signals from several other channels, which distinguishes it from a single report anomaly.
Regarding regulated derivatives, CME reported that average daily trading volume of cryptocurrencies in the first quarter increased from 191,000 contracts to 310,000 contracts year-on-year, and average daily open interest reached 313,900 contracts, an increase of 25% from Q1 2025.
This level of open interest means capital is staying in the market, indicating a longer-term positioning posture.
A CoinShares report notes that blockchain equity ETFs have raised $617 million in capital over the past three weeks, reinforcing the view that financial institutions are buying infrastructure exposure alongside their direct coin positions.
Corporate financial accumulation continues on its own trajectory. According to the Bitcoin Treasury, Strategy’s April 27 SEC filing shows that an additional 3,273 BTC were purchased between April 20 and April 26, for a total of 818,334 BTC, for a total cost of $61.8 billion.
Hong Kong-listed Bitfire is targeting more than 10,000 BTC within a year with its regulated “Alpha BTC” strategy, while Avenir held $908 million of BlackRock’s IBIT at the end of 2025.
The geographic spread of US corporate treasuries, regulated Asian asset management, and global investment products all moving in the same direction gives the demand recovery a structural quality that cannot be established by a single weekly inflow report.
DefiLlama has a stablecoin market cap of approximately $320.7 billion, increasing by 1.73% in 30 days. This means that the preparatory infrastructure for putting money into Bitcoin is expanding.
beyond demand
The market structure has added layers that make it difficult to read that the recovery in demand has taken hold.
Glassnode’s April 22nd report states that Bitcoin is trading above the true market average of $78,100, with a short-term holder cost basis of $80,100 as the upper limit of resistance for the time being.
ETF flows turned slightly positive again, and spot demand showed early signs of recovery. Glassnode also reported that short-term holders saw profits jump to $4.4 million per hour, nearly triple the $1.5 million benchmark that marked the region’s highest price so far this year.
At this pace, recent buyers are locking in profits at a pace that the market has historically struggled to absorb without a pause or pullback.
Glassnode’s spot breakdown noted that Binance’s cumulative volume delta (CVD) has been driving much of the recent buying, while Coinbase’s activity has remained relatively subdued.
Coinbase is a major venue for spot activity among U.S. institutional investors, and with the recovery being fueled by offshore retail and mid-cap funds, bids are not as locked in as major inflows suggest.
Farside Investors’ daily US ETF data makes the same point from a different angle. The Spot Bitcoin ETF recorded positive flows for nine trading sessions, exceeding $2 billion, but turned negative on April 27th.
The $1 billion inflow measurement over three weeks and the one-day reversal could both be true at the same time, and together they explain a demand recovery that is directionally realistic but still fragile enough to break out on a macro catalyst.
| Improved signal | vulnerability signal |
|---|---|
| ETF flows turned slightly positive again | 80. $1,000 remains as an immediate resistance level. |
| Spot demand showed early recovery | Realized profits increased to $4.4 million/hour |
| Bitcoin regains true market average of $78.1 million | Coinbase’s activities remained silent |
| Weekly product inflow exceeds $1 billion for 3 consecutive weeks | Profit-taking risk increases as buyers earn profits |
The FOMC’s April 28-29 meeting will be the first tough test to see whether the institutional bid, which took four weeks to build, can hold its ground.
CoinShares clearly links current investor caution to its decision window, and Glassnode’s market structure data explains Bitcoin edging toward the $80,100 zone, where over 54% of recent buyers have reaped profits, but historically the zone where secondary selling has exhausted a bear market rally.
The Fed’s outcome of leaving monetary conditions largely unchanged removes the biggest near-term macro headwind.
A hawkish surprise, or language that further tightens the rate cut schedule, would give sellers exactly the external trigger they need to act on their expectations for higher earnings.
Two paths ahead
The bullish case rests on Fed passage without adding new macro stress, weekly commodity inflows remaining near or above $1 billion, US ETF demand reaccelerating beyond the April 27 disruption, and Coinbase spot activity closing the gap with offshore venues.
The recovery in demand will be self-reinforcing, and if Bitcoin clears $80,100 on the back of consistent spot absorption, the market structure will move from a “testing rally” to a regime of confirmed demand, drawing in the next tier of institutional investors who have been waiting for the price structure to confirm the flow data.
In that scenario, an October 2025 AUM peak of $263 billion would be the relevant reference point, and three consecutive weeks of inflows would be read as the early stages of sustained re-engagement.
If you’re bearish, run the same variables in the opposite direction. If the Fed tightens last-minute financial conditions again, the weekly flow streak breaks, and Glassnode’s realized profit warnings begin to dominate price trends, the recent moves will likely resolve into new distribution increases, especially if demand for the ETF wanes and prices fail to rise above the collection average.
Glassnode’s own records show that the bull market so far this year has struggled at that point, and the breakdown at $78,100 could accelerate faster than inflow data predicts, as the liquidity situation remains tenuous.
Total assets under management were $155 billion, 41% below October’s peak, meaning unwound institutional exposure is much higher than current levels.
| scenario | trigger | something that supports it | what breaks | why is it important |
|---|---|---|---|---|
| bull case | Fed passes without adding new macro stress | Weekly inflows into digital asset investment products remain at or above levels 1 billion dollars;U.S. spot Bitcoin ETF demand accelerates again after the April 27 turmoil. Coinbase’s spot activities close the gap with offshore venues. bitcoin clear $80,100 With lasting spot absorption | Fed hawkish statements, decline in ETF flows, resumption of offshore-only buying, or failure to break out $80,100 | The recent streak of inflows confirms the beginning of more durable institutional investor re-engagement, paving the way for Bitcoin to challenge higher benchmarks. $263 billion AuM peak in October 2025 |
| basic case | The Fed is largely neutral and will not significantly change financial conditions | Weekly flows remain positive but below recent flows over $1 billion Pace; ETF flows remain mixed. Bitcoin remains on top $78,100 However, it is difficult to definitively clear it. $80,100 | A sudden deterioration in ETF demand, an increase in profit-taking, or the following breakdown: $78,100 | Suggests that financial institutions are re-engaging, but not yet confident enough to move the market to a fully confirmed demand regime |
| bear case | Fed tightens conditions on margins or signals less supportive interest rate path | Weekly continuous flow is interrupted. Demand for ETFs will wane. Warnings regarding Glassnode’s realized profits begin to dominate price trends. Bitcoin fails in the following ways $80,100 and lose $78,100 | Dovish or moderate Fed results resumed over $1 billion Weekly inflows, increased participation in Coinbase, and $80,100 | We are reframing the recent move as a new circulation rally rather than a sustained recovery, with thin liquidity making the downside steeper than the inflow data alone would suggest. |
CoinShares’ third consecutive week of $1 billion, CME’s high open interest, Strategy’s continued accumulation, and a deeper base of stablecoin liquidity all point to capital returning to Bitcoin with greater conviction.
The recovery has been occurring simultaneously across enough channels to eliminate single-venue anomalies, and the Fed is now determining whether the market can sustain this movement.
(Tag translation) Bitcoin