
Ethereum has climbed above $2,300 and bulls are attempting to reclaim the levels that have defined the upper bound of recent price ranges. While still short of its $2,400 target, CryptoOnChain’s report identified that there is something in the order flow data that reframes the current price trend as much more constructive than the charts alone suggest.
This report simultaneously examines the taker-buy-sell ratio (a measure of how actively buyers and sellers are participating in the market) on both Binance and all major exchanges. What the study found is a difference that is difficult to ignore. While the price of Ethereum has fallen from around $4,700 in October to around $2,300 today, the 30-day moving average of this ratio is moving in the opposite direction. It soared to its highest level since late January 2023 on both charts and in both venues at the same time.
The context is important. January 2023 was not a random data point. It sits near the bottom of the last bear market, at which point aggressive buyers began soaking up supply at levels that most participants deemed too risky to touch.
Ethereum is not $1,000. However, the buying behavior now appearing in derivatives data has not been seen since that moment, and the last time it appeared, prices were a fraction of today’s levels.
Prices will fall. Buyers say otherwise
CryptoOnChain reports specify exactly what the data describes. The disconnect between falling prices and rising taker-buy-sell ratios contains two messages, both pointing in the same direction.
The first is accumulation. When this ratio exceeds 1 and reaches multi-year highs, it means that the market’s buy orders are not just there, but are overwhelming the sell orders. At a price of $2,300, aggressive buyers are cautiously reluctant to bargain. They have intervened with enough force to simultaneously control the world’s largest derivatives exchange and the order flow of all major exchanges. Large participants and active traders are treating the current price level as a zone worth building toward, rather than a zone worth waiting for.
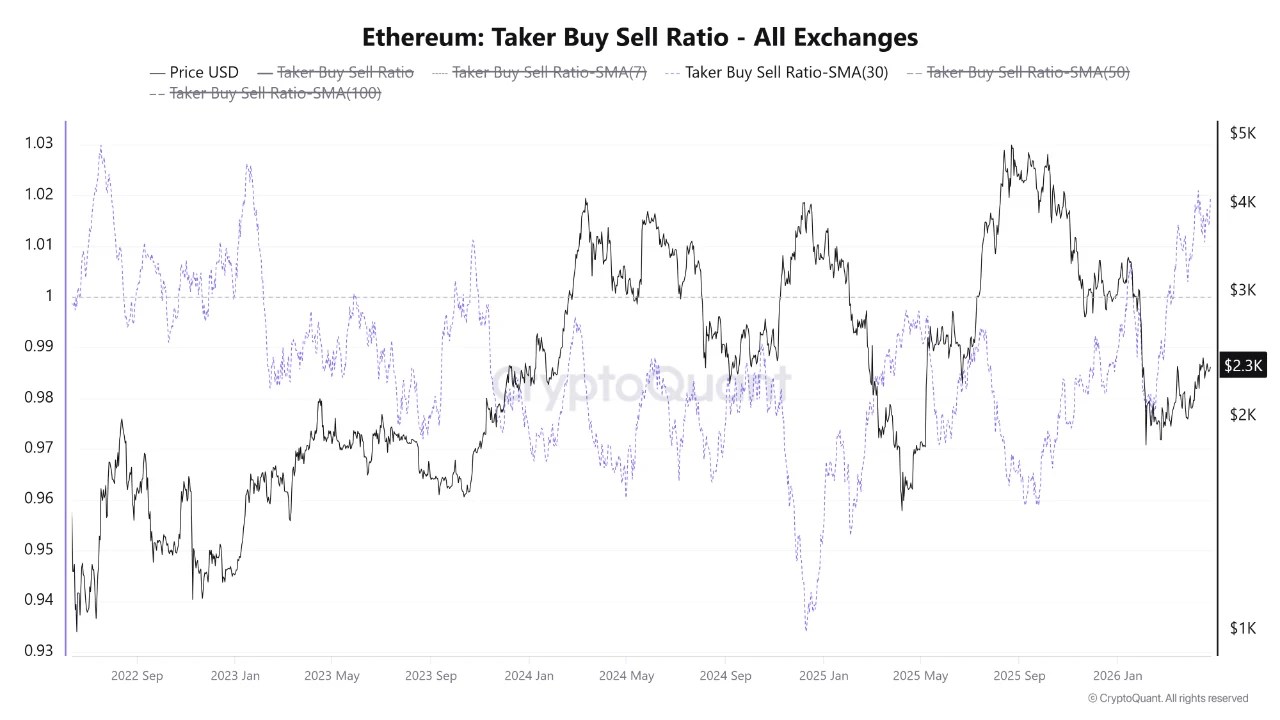
The second message is seller exhaustion. When buying aggressiveness reaches multi-year highs amid sustained price declines, it usually reflects that the market is nearing a point where the available selling supply is depleted. Since October, sellers have been in control. Order flow is starting to show the limits of that control.
Together, the two signals represent a market that appears bearish on the surface but is quietly changing underneath. The price trend has been declining in recent months. The underlying demand trend is moving in the opposite direction, and the gap between the two has reached some sort of extreme situation that, historically, will never resolve in favor of the seller.
Ethereum stalls below resistance as compression continues
Ethereum continues to trade in a narrow range below the $2,400 level, reflecting a market that is stabilizing but has not yet broken out. The recovery from February lows around $1,800 remains intact. $ETH Forms a series of lows and confirms a short-term bullish structure. But that progress is now encountering a well-defined group of resistance.
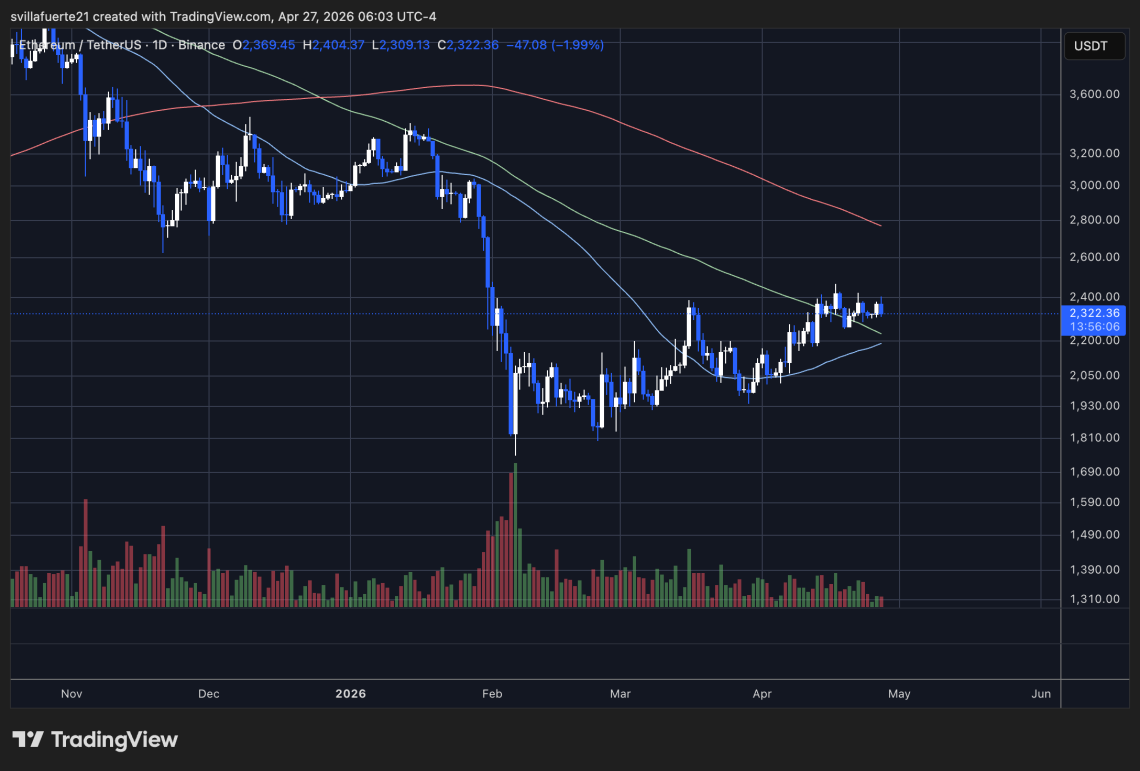
The $2,350-$2,400 zone has rejected repeated attempts to move higher and is roughly in line with the downward sloping 100-day moving average. This creates a technical ceiling above which sellers continue to absorb demand. At the same time, the 50-day moving average is rising below the price near $2,200, acting as dynamic support and compressing the range.
This type of price compression is typically done prior to expansion. The problem is direction. Volume provides limited support as the strongest activity remains tied to February’s decline, although the recovery is progressing based on more moderate participation. This suggests that demand is there but not yet aggressive.
If Ethereum can maintain its momentum and regain $2,400, the next resistance level will be near $2,800. A rebound from current levels would likely result in an extended consolidation with downside risk towards the $2,100-$2,200 support zone where buyers have been consistently intervening.
Featured image from ChatGPT, chart from TradingView.com