
New on-chain data shows that Ethereum is trading close to significant demand levels amid continued volatility across crypto markets. The second-largest cryptocurrency by market capitalization has been hovering near short-term support after weeks of selling pressure.
summary
- Ethereum price approaches major support: Ethereum is trading near short-term support levels after weeks of selling pressure, with the current price around 8% above the cumulative address realized price, a key indicator for long-term investors, according to CryptoQuant on-chain data.
- Long term holders remain active: Despite market volatility, 17 million Ethereum coins will flow into accumulation addresses in 2025, and the balances in these wallets will increase from 10 million to over 27 million, demonstrating continued interest from long-term investors.
- Technical analysis shows mixed signals:Ethereum remains above structural support near the 200-week moving average, although the 50-week moving average is acting as resistance. Breaks above and below these levels can indicate a change in market momentum.
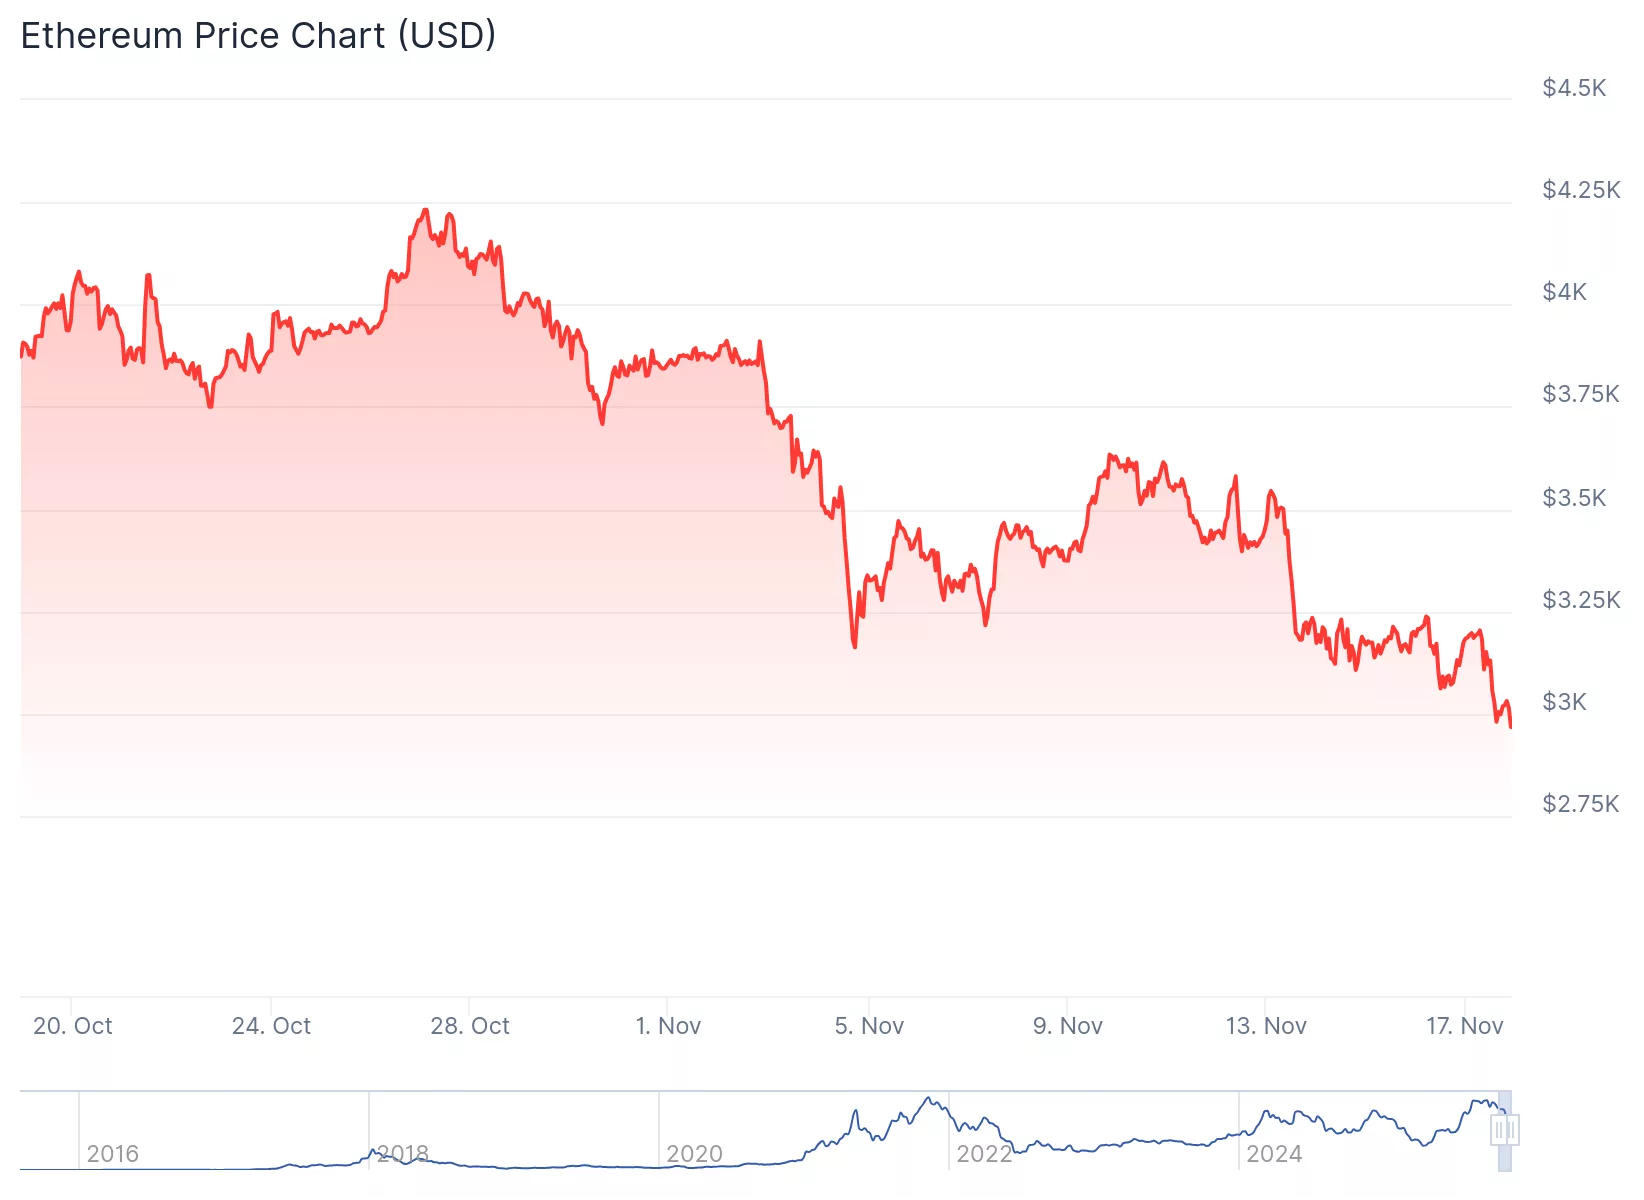
Source: CoinGecko
The current price of Ethereum is $2,967.76. It has decreased by 23.4% over the past month. However, CryptoQuant analyst Burak Kesmeci said the price is about 8% above the cumulative address realized price level, a measure that represents the average cost basis of long-term investors who acquired assets during past market cycles.
“The accumulation corresponds to realized price levels and tracks the average cost basis of long-term Ethereum holders who acquired the cryptocurrency over multiple market cycles,” Kesmeci said in the report. Our analysis shows that this group of investors typically buys during times of market stress.
According to historical data, Ethereum has only fallen below this level once, in April, when uncertainty increased in global markets. The Global Economic Policy Uncertainty Index (GEPUCURRENT) has reached a level above that recorded during the peak of the COVID-19 pandemic, data showed.
In 2025, approximately 17 million coins flowed into accumulation addresses, and the total balance of these wallets increased from 10 million to more than 27 million. This accumulation occurred despite widespread market volatility.
Technical analysis of Ethereum’s weekly chart shows that the asset remains above structural support around its 200-week moving average, a level that marked a significant price bottom in previous cycles. According to chart data, prices briefly fell below this zone last week, but have since recovered.
The 50-week moving average is currently acting as an immediate resistance above the current price level. A move above this average would indicate a potential change in momentum. At the same time, a break below nearby structural support could trigger further corrections towards the cumulative realized price levels identified in the CryptoQuant analysis.
Market observers note that the current price movement resembles corrections in the past, such as the April 2025 selloff, when Ethereum tested long-term support levels before recovering. According to market analysts, the convergence of technical and on-chain indicators suggests that the current price level has attracted the attention of long-term holders and institutional investors.
read more: Bitcoin plummets, crypto market faces steep decline as fear grows