

Ethereum is trading above $2,300. The rate of increase of 8-9% in 24 hours is higher than Bitcoin. And XWIN Research Japan’s analysis identified something that separates the current rally from any short-term pullbacks Ethereum has generated over the past few months. That means the catalyst this time is not of the same type.
This analysis documents the simultaneous convergence of three independent developments that arrive within days of each other. On April 13, the SEC issued a staff statement clarifying that certain DeFi user interfaces (front-end and wallet-based applications) may operate without broker-dealer registration if certain conditions are met.
From a practical perspective, the regulators that have cast the longest shadow over the institutional adoption of DeFi have just indicated that DeFi can be treated as a neutral technology layer rather than a securities distribution mechanism. That’s not a trivial explanation. This is a structural mitigation of regulatory risk for the entire Ethereum ecosystem.
On-chain data confirms that changes in real behavior are being felt. The number of active addresses on Ethereum is on the rise, expanding not only the price but also the usage of the network. At the same time, Coinbase’s premium gap has improved, suggesting that US-led demand (institutional demand, which has not been noticeable in previous recovery attempts) is starting to return.

There are three catalysts. 1 week. None of this is leverage.
the agency has arrived
XWIN Research Japan’s analysis adds a capital layer that transforms regulatory and on-chain signals into a complete structural picture. ETF inflows marked the third consecutive day of net inflows, hitting the highest weekly level in 2026. These are not traders who react to price movements, but rather portfolio allocators who make persistent and deliberate decisions to increase their exposure to Ethereum at an institutional level. Three straight days of 2026 weekly highs represents conviction, not momentum.
At the company level, the signals become even more specific. Bitmine currently holds approximately 4.8 million ETH (over 4% of Ethereum’s total supply), with over 70,000 ETH added in the past week alone. The similarities with MicroStrategy’s Bitcoin accumulation strategy are no coincidence. That’s the point.
When publicly traded companies begin treating their assets as financial reserves rather than speculative positions, they are permanently deprived of liquidity markets and demonstrate a belief in long-term value that short-term price action cannot create.
The analysis gives the combined images an accurate name. This is not a leverage-driven rebound. It’s a structural change. Regulatory clarity, an influx of institutional capital, and increased network activity have arrived simultaneously. And when these three forces work together on the same asset at the same time, the question stops being why the price went up and starts to become what the asset is going to be like.

Ethereum is transitioning into what analysts call a DeFi infrastructure asset. This is a different category than speculative tokens or stores of value, and one where the network’s usefulness as a payments and execution layer for global finance is the main driver of institutional demand. Prices are starting to reflect that change. The structure below shows that the migration is not complete.
Ethereum is attempting to recover from a sharp structural collapse in February, when a massive capitulation move pushed the price from around $3,000 to sub-$2,000 levels. This event remains the main feature of the chart, marking a clear transition from the distribution phase to a positioning reset.
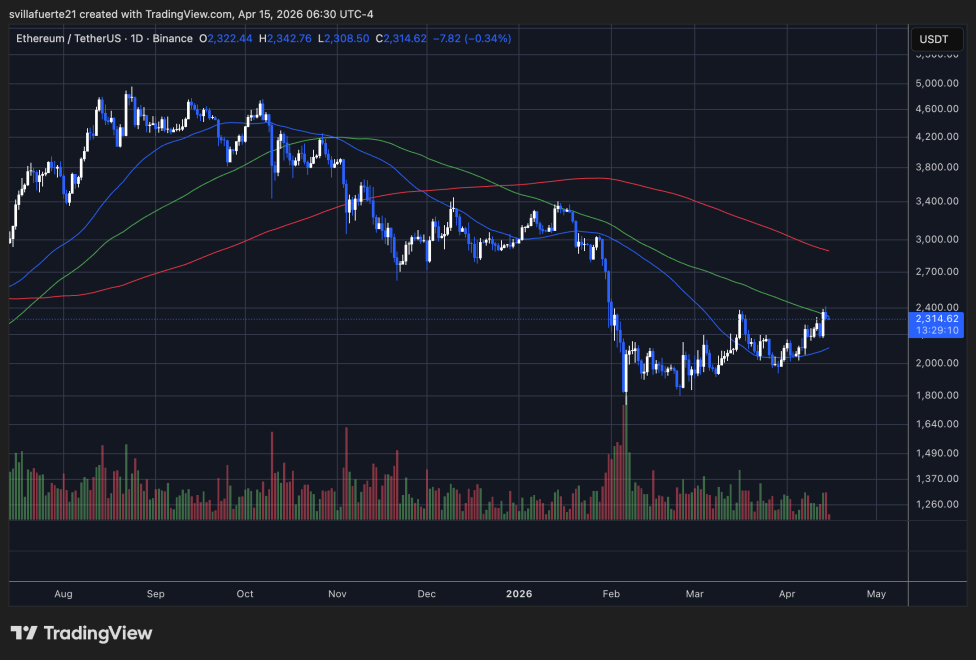
Since then, ETH has established a base between roughly $1,900 and $2,200 and has repeatedly made new lows, suggesting that selling pressure is gradually being absorbed. The recent rally to $2,300-$2,400 has brought the price back into the critical supply zone, which previously acted as support before the break and is now acting as resistance.
Technically, ETH is still trading below its 200-day moving average (red) and 100-day moving average (green), both of which are trending down, confirming that despite the short-term strength, the overall trend remains bearish. However, the 50-day moving average (blue) has leveled out and started to turn higher, indicating that near-term momentum is improving.
Volume has fallen significantly compared to February’s surge, suggesting the recovery is controlled rather than impulsive. This usually reflects a repositioning rather than active speculation.
The key question is whether ETH can regain and maintain $2,400. Failure here can widen the range. Any higher acceptance would move the structure into a sustained recovery phase.
Featured image from ChatGPT, chart from TradingView.com
editing process for is focused on providing thoroughly researched, accurate, and unbiased content. We adhere to strict sourcing standards, and each page is carefully reviewed by our team of top technology experts and experienced editors. This process ensures the integrity, relevance, and value of your content to your readers.