Bitcoin is trading around $71,000 as global markets enter a cautious holding pattern. Investors are keeping an eye on whether the recently announced ceasefire between the United States and Iran holds, and what effect the ceasefire resolution will have on broader risk sentiment.
Until there is more geopolitical clarity, the crypto market appears content to consolidate rather than commit to a directional move.
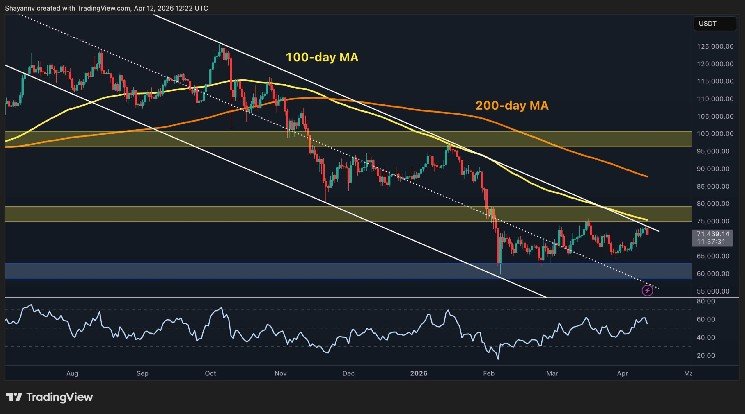
Bitcoin Price Analysis: Daily Chart
The long-term downtrend continues on the daily chart. $BTC is trading within a descending channel, below both the 100-day moving average (~$75,000) and the 200-day moving average (~$87,000). The $75,000 to $80,000 resistance band remains the key upper limit as it has rejected all attempts at recovery since the February crash. Both moving averages have declined as well, indicating that the overall trend has not yet reversed.
That said, the RSI has been trending upward since the February lows and is currently hovering above 50. This shows that momentum is still dominated by buyers, but only to a small extent. The $60,000 support area remains the most important level for buyers to defend, and a breakdown could push the price towards the $55,000 area. On the other hand, a move above $75,000 to $80,000 on strong volume would be the first meaningful signal that the trend is changing.

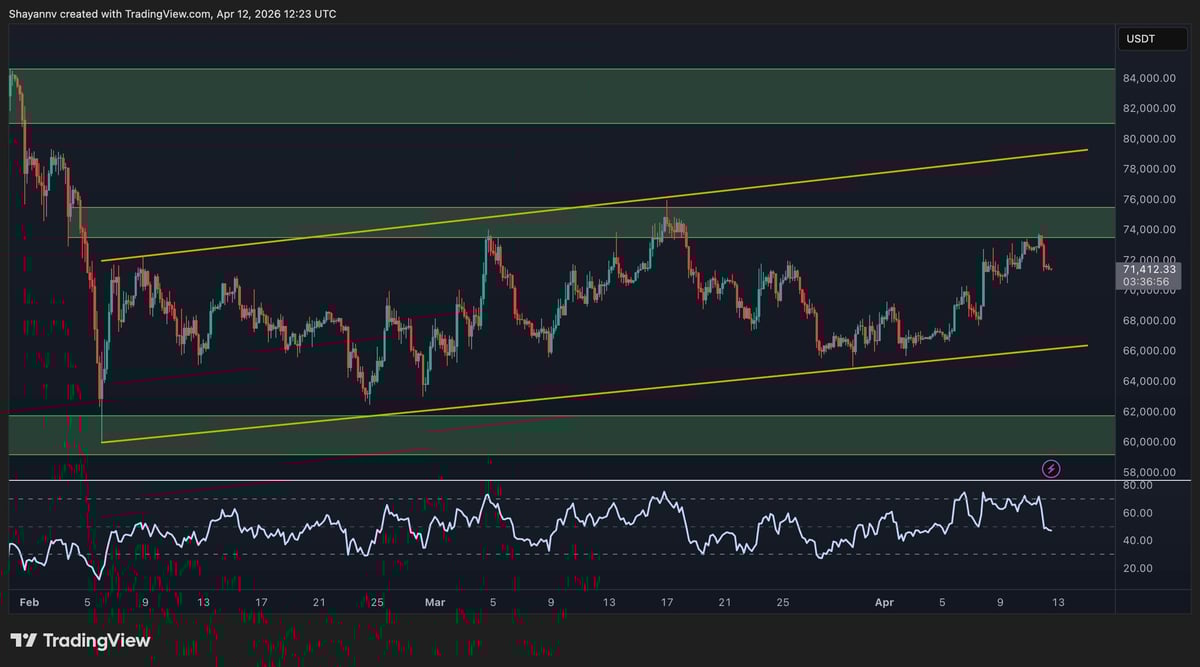
$BTC/USDT 4 hour chart
The short-term uptrend channel that has formed since the February lows is the dominant structure on the 4-hour chart, with the asset currently sitting at $71,000. The $74,000 to $76,000 area has recently rejected the downside, and the market is at risk of revisiting the lower end of the pattern, which is currently near $67,000.
However, the RSI for this time frame has dropped significantly and is now below 50. Although we are not deep into bearish territory yet, this signals a potential shift in momentum to the bearish side in the near term.
A confirmed close above $75,000 would invalidate the bearish scenario and push the price towards the $80,000 level. On the other hand, a deeper decline and breakdown below the lower trend line is more concerning and could bring the focus back to the $60,000/day support zone.
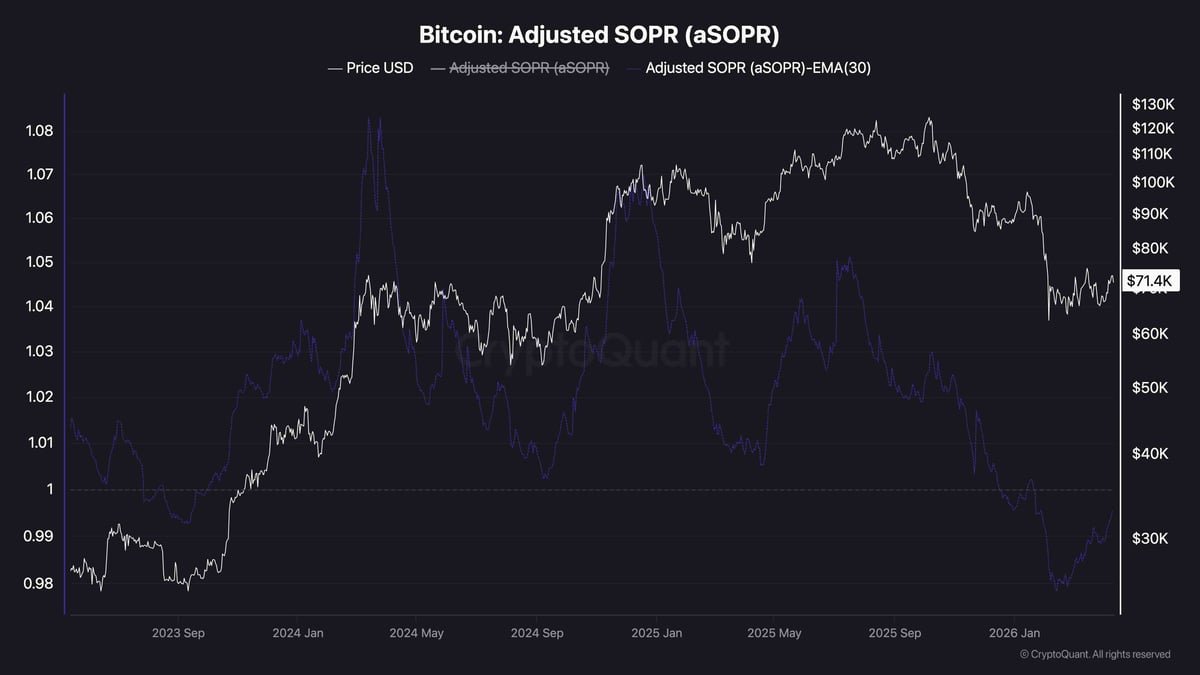
On-chain analysis
Adjusted SOPR (aSOPR) is currently outputting values less than 1.00. This is the level that indicates that the coin is being spent at a loss overall. What makes the current numbers particularly impressive is that aSOPR’s 30-day EMA has fallen to levels last seen at the end of the last bear market, when Bitcoin was trading at around $25,000.
In other words, the movement in on-chain realized losses at current prices mirrors the intensity of the capitulation seen at cycle lows nearly three years ago at a fraction of the price.
Previously, when the aSOPR value remained below 1.00, especially when the EMA confirmed the trend, it indicated a late stage of surrender rather than the beginning of a new downtrend. However, given the overall geopolitical and economic environment, this does not guarantee that a reversal is imminent, but it does suggest that sellers may be exhausted at these levels, and analysts would like to see it be what is called a bottom formation.