Bitcoin has succumbed to intense selling pressure and lost several major support levels in the past few weeks, but is currently holding major support levels. The broader market structure continues to favor sellers, but the market’s reaction to the critical $60,000 demand zone could determine the next big move.
Bitcoin Price Analysis: Daily Chart
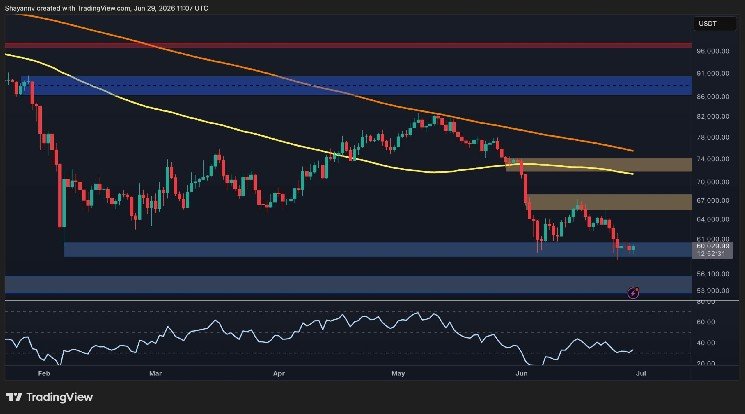
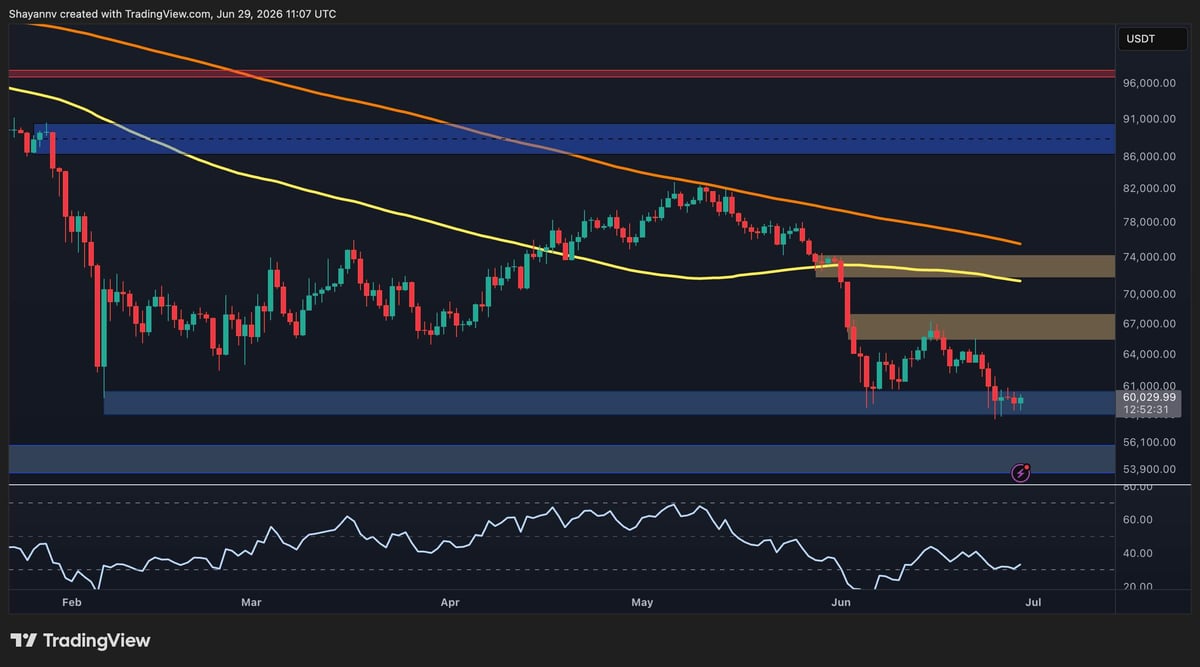
In the daily time frame, $BTC The stock is now trading below $60,000 after widening its decline following a rejection near $82,000. The breakdown below the $74,000 resistance area also coincided with the 100-day moving average, confirming a bearish shift in market structure and accelerating the recent decline.
The asset is currently testing a major support zone around $60,000, and buyers have managed to slow the decline. This region also served as a key demand area at the beginning of the year and helped prevent the February crash, making it an important level to watch. As long as Bitcoin stays above this range, the market could attempt a rescue rebound.
However, the overall trend remains bearish. Both the 100-day and 200-day moving averages are sloping downward, with the 200-day moving average sitting near $75,000 and continuing to act as the ultimate dynamic resistance. Meanwhile, the $67,000 zone represents the first major resistance to any recovery attempt, followed by a stronger supply area at $74,000.
On the downside, if the daily close falls decisively below the $60,000 support, the next major demand area could be around $54,000, potentially extending the current correction phase.
$BTC/USDT 4 hour chart
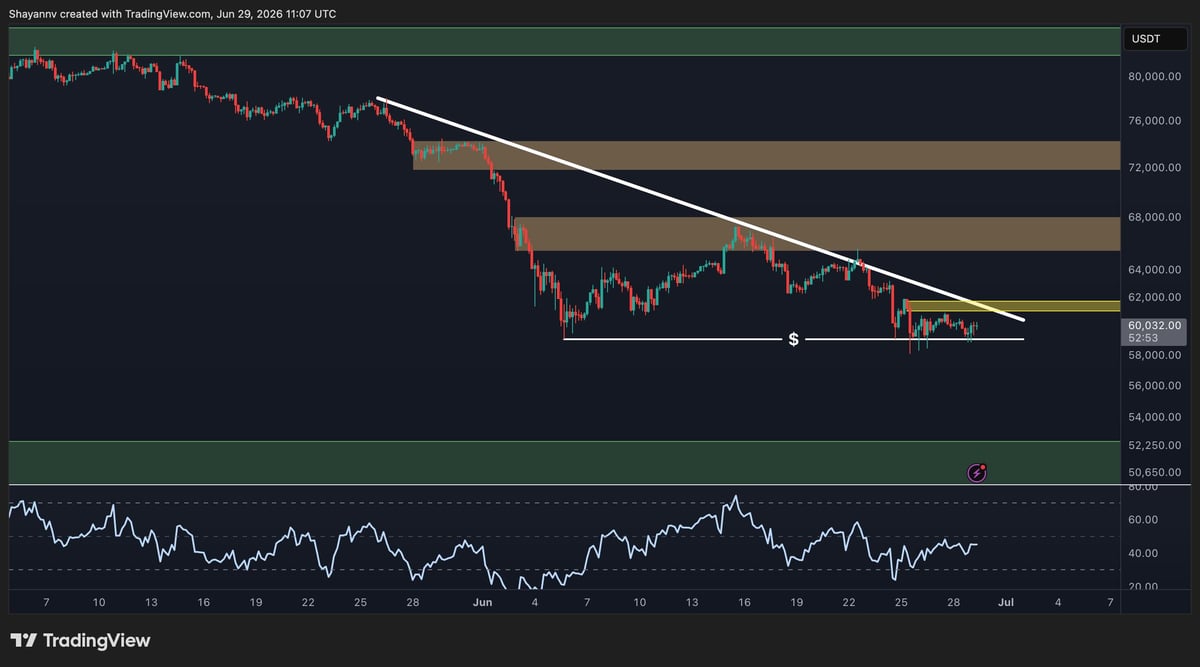
The 4-hour chart highlights a clear downtrend line that has consistently suppressed any recovery attempts since late May. Recently, the price tested this trend line again but failed to break above it, reinforcing the bearish control over the short-term structure.
$BTC It is currently consolidating just above the horizontal support around $60,000, forming a relatively narrow trading range after the recent rejection. The RSI has also recovered from its oversold condition and is moving near the midline, suggesting that the downward momentum is calming down, although there is still no convincing bullish momentum change.
The first hurdle for buyers remains the downtrend line, currently located just below the $61,000 to $62,000 resistance zone. A successful breakout of both levels could trigger a short-term recovery towards the $67,000 supply area.
On the other hand, if the bearish candlestick closes below it and loses the $60,000 support, the current consolidation could be invalidated and the selling accelerate towards the next daily demand zone around $54,000.
On-chain analysis
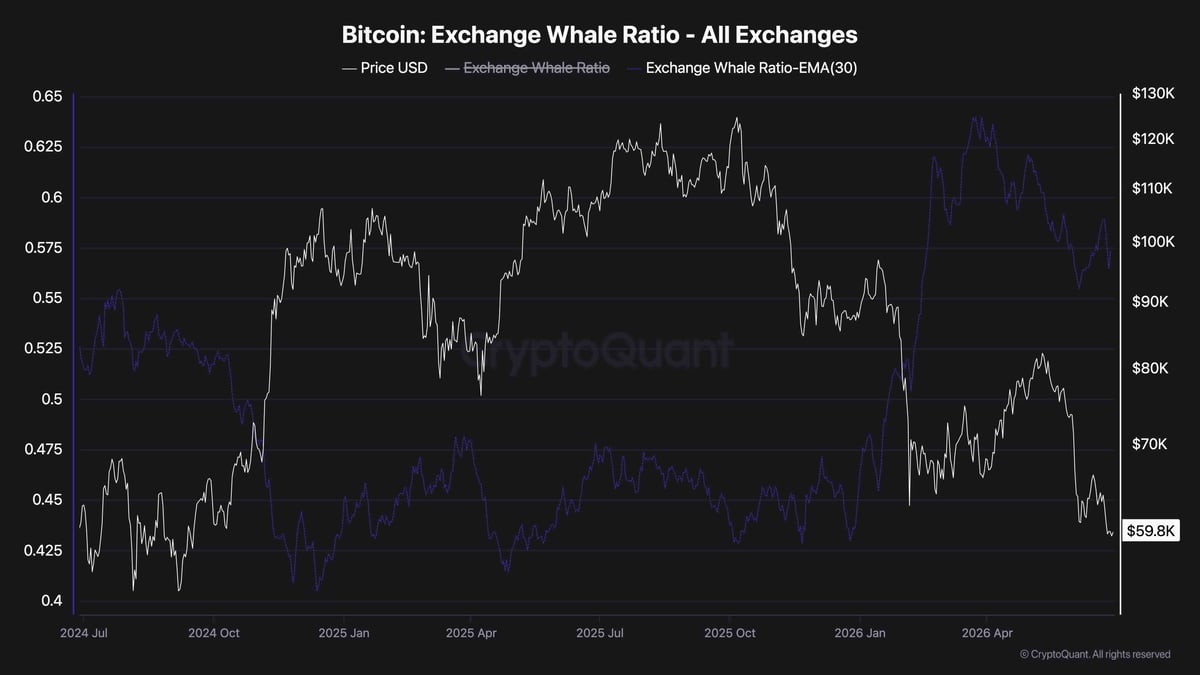
The exchange whale ratio, which indicates the ratio of inflows to top exchanges to total inflows, has been on the decline with the recent decline in Bitcoin. In general, lower measurements indicate that large holders are contributing less to foreign exchange deposits, which suggests that aggressive whale sales have eased compared to previous periods.
This curbing of whale activity may alleviate immediate pressure on sellers, but a bullish reversal has not yet been confirmed. Although Bitcoin continues to trade at key technical support, the overall market structure remains bearish, indicating that buyers need to reclaim key resistance levels before a sustained recovery is likely.
For now, the combination of steady whale inflows and price holding above the $60,000 support zone is providing the first signs that selling pressure may be easing. Nevertheless, for it to be confirmed, Bitcoin would need to break above the 4-hour downtrend line and regain the $67,000 area before sentiment starts to shift in the bulls’ favor.