
Bitcoin traded at $81,411 on May 6, surpassing $81,000 for the first time since January as tensions in Iran eased and global stocks set new records, but briefly fell below that level after comments from Michael Saylor about the possibility of selling Bitcoin for the first time in Strategy’s history.
$BTC 4-hour chart: OBV confirms movement while ascending channel remains
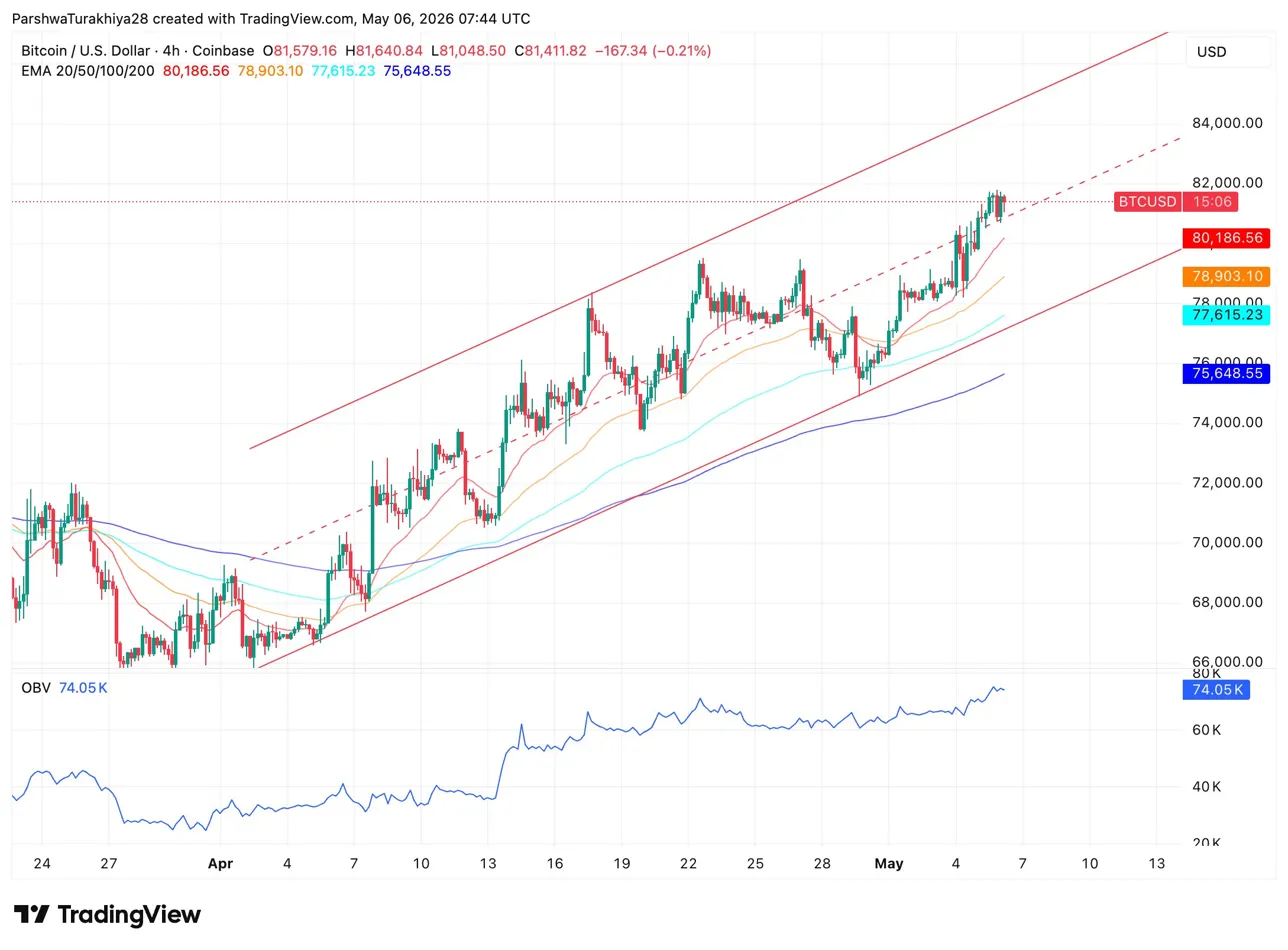
The 4-hour chart shows: $BTC It is within a clean upward channel that has remained intact since the lows near $67,000 on April 7th. The floor has held through all the declines over the past four weeks, and the price is now approaching the upper bound around $81,500 to $82,000. This channel has produced a series of lows and highs, each supported by a rising EMA stack below.
The OBV indicator below the chart is making new highs along with the price, confirming that volume is behind the move, rather than volume decreasing as the price rises. This divergence is important because the main concern about Bitcoin’s April rally was that it was futures-driven rather than spot-driven. A rise in OBV is a necessary spot demand confirmation on the chart.
Related: Zcash Price Prediction: ZEC Soars 30% as Bullseye $600 Target
The 20-day EMA at $80,186 provides immediate support for a pullback, while the 50-day EMA lies below at $78,903. Both are rising and building bullishly. A close above the $82,000 channel ceiling will open the next resistance zone between $86,000 and $88,000.
$BTC Key levels for May 7th:
- 50-day EMA: $78,903
- 20-day EMA: $80,186
- Current price: $81,411
- Channel limit: $82,000
- Next resistance zone: $86,000 to $88,000
Four days of ETF inflows suggest physical demand is returning
The Bitcoin Spot ETF recorded net inflows of $467.35 million on May 5th, marking its fourth consecutive day of positive gains. BlackRock’s IBIT led the way with $251.43 million, followed by Fidelity’s FBTC, which added $133.2 million, and Ark and 21Shares’ ARKB, which contributed $92.28 million.
The reversal in flow direction at the same time as OBV hit new highs is the clearest sign that spot demand is returning to support the futures-led April rally, which CryptoQuant warned was structurally weak.
Strategy could lead to Bitcoin sales for the first time
Michael Saylor said during Strategy’s Q1 2026 earnings conference that the company may sell some of its 818,334 shares. $BTC For the first time in the company’s history, it has set aside funds for dividend payments. His exact words are: “We will probably sell some Bitcoin and pay dividends just to vaccinate the market and send a message that we did it.”
The strategy has an annual dividend obligation of approximately $1.5 billion in preferred stock and outstanding debt, and approximately 18 months of U.S. dollar reserves at current operating rates. The company posted a net loss of $12.54 billion in the first quarter, as Bitcoin’s decline from its peak of $126,000 in October weighed on mark-to-market accounting. Each quarter to date, Strategy has issued more bonds or equity to fund debt, rather than impact financing. $BTC position. This is my first time selling even a small amount.
Related: Cardano Price Prediction: Hoskinson hits back at scaling critics as ADA pushes channel cap
MSTR fell more than 4% in after-hours trading, $BTC It briefly fell below $81,000, but has since recovered. While Thaler framed the potential sale as consistent with a broader model of buying Bitcoin on credit, allowing it to rise in value, and then selling some to pay dividends, the market interpreted this as a departure from the unconditional accumulation strategy that has defined the strategy since 2020.
$BTC Derivatives: Short product woes worsen despite falling prices
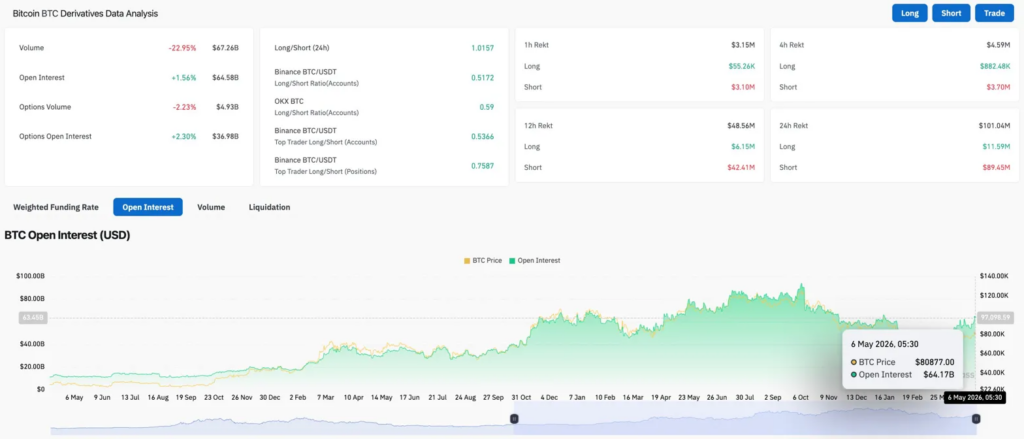
Futures trading volume decreased by 22.95% to $67.26 billion, while OI increased by 1.56% to $64.58 billion, indicating lower volume while OI was building and positions were being quietly held rather than aggressive new entries. Options volume decreased 2.23% to $4.93 billion, but option OI increased 2.30% to $36.98 billion, as existing directional hedges remained open even as new trade dried up.
The long/short ratio is 1.0157, which is just barely long. Top traders on Binance are short with accounts at 0.5366 and positions at 0.7587, while OKX accounts remain at 0.59. In 24 hours, shorts absorbed $89.45 million in liquidations, while longs had $11.59 million. Even though the price was flat on the day, sellers were in more than 7x pain, which is consistent with short sellers being squeezed every time the price rises above $81,000. OI is $64.17 billion, below its peak of around $90 billion in late 2025.
$BTC Price prediction: Outlook for May 7th
- Upwards: $BTC It closes above the $82,000 channel boundary and opens up the $86,000 to $88,000 resistance zone. With four consecutive days of ETF inflows and OBV hitting new highs, the rally supports spot demand that was missing in April.
- Disadvantages: Check specific strategies $BTC The selloff is a headline risk that will push the price back toward the lower end of the channel between $78,000 and $79,000. Shorts absorb the pain of a 7x liquidation, so unless the Saylor news escalates further, the extent of the decline is limited.
RELATED: Solana Price Prediction: Alpenglow Upgrade Expected Next Quarter as EMA Ribbon Turns Bullish