
Bitcoin fell below $62,000 on Friday, briefly approaching the $61,000 level, as weak demand and increased selling pressure from short-term holders weighed on prices.
The move comes amid a widespread risk-off environment across global markets. Momentum indicators remain bearish and further declines are expected in the short term.
Bitcoin demand continues to decline
Bitcoin has fallen more than 1% in the past 24 hours and is currently trading above $62,000.
The coin briefly touched the $61,100 level early Friday morning, but has now recovered slightly to above $62,000.
The bearish performance came amid declining demand for Bitcoin.
New on-chain data from CryptoQuant highlights a significant contraction in market activity, suggesting that overall demand for Bitcoin has deteriorated to its weakest point in the current cycle.
According to the data, spot demand fell to -272,000 $BTC On a 30-day cumulative basis, futures demand decreased to -229,000. $BTC.
Thanks to this latest development, total demand contraction now stands at nearly 501,000. $BTC.
The contraction in demand indicates that selling pressure has consistently outpaced buying activity throughout much of the year, even with brief periods of institutional inflows.
Analysts said the decline was due to negative macroeconomic conditions, including rising bond yields, persistent inflation and geopolitical uncertainty.
In this environment, liquidity is reportedly shifting toward equities, particularly tech and AI stocks, as well as foreign exchange and precious metals.
On-chain actions indicate that short-term holders (STH) are experiencing one of the biggest capitulation events this year.
The report states that approximately 53,800 people $BTC Money was sent to exchanges with losses, while inflows from profitable positions fell to almost zero.
This pattern reflects growing panic among recent buyers as unrealized losses deepen.
Historically, similar capitulation events have frequently occurred near local market bottoms, but analysts caution that they are not in themselves a reliable reversal signal.
However, if demand does not recover, continued selling could prolong the correction. Nevertheless, oversold conditions can indicate that the bottom is near.
Market sentiment further weakened after Strategy Inc. announced its first Bitcoin sale in over four years, revealing that it had sold 32 Bitcoins. $BTC To pay dividends on preferred stock.
According to market commentary, the company’s Bitcoin holdings currently face an estimated $10.8 billion in unrealized losses.
JUST IN: Michael Saylor's "Strategy" now has an $11.5 billion unrealized loss on its Bitcoin
— Kalshi (@Kalshi) June 4, 2026
Bitcoin technical outlook: bearish structure remains
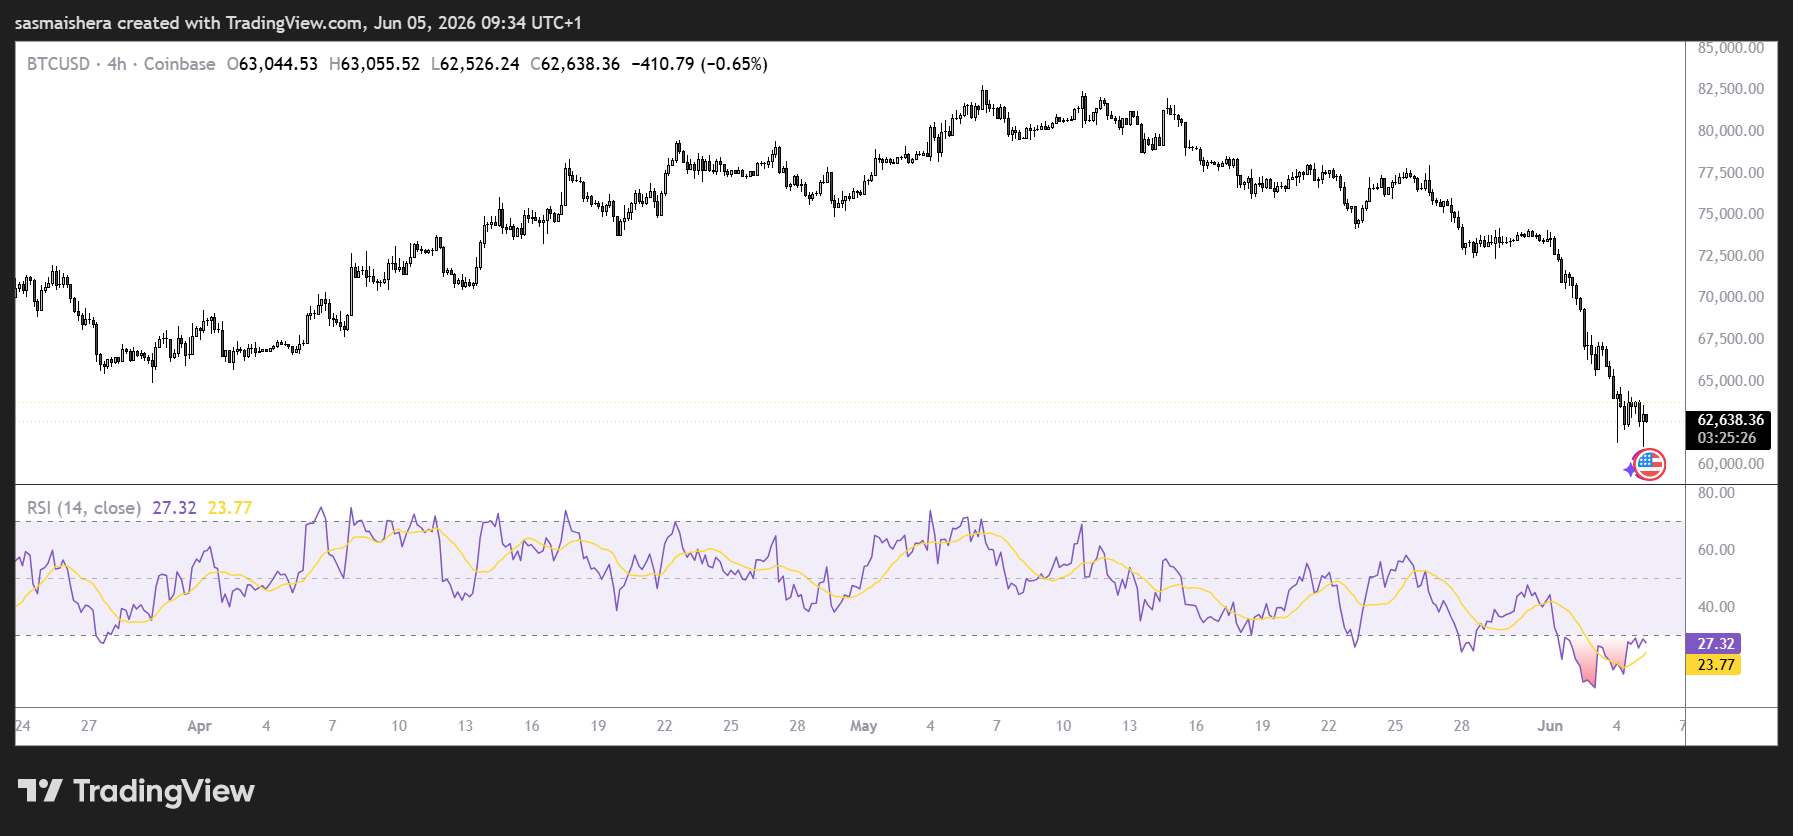
of $BTCThe 4-hour chart of /USD is very bearish as Bitcoin is trading below its 20-day, 50-day, and 100-day exponential moving averages.
These averages form a layer of resistance between approximately $72,900 and $75,800.
Momentum indicators indicate a highly oversold situation. The RSI is around 27, indicating extreme downward momentum, but the MACD line is also in oversold territory.
These numbers suggest that the sell-off could be extended, but price action remains subdued below significant resistance.
If the bulls regain control, the first resistance level will appear around $65,103. If the rally drags on, $BTC Rising towards the major resistance zone between $72,874 and $75,796.
However, Bitcoin loses the $62,520 support level and could fall towards the secondary support at $59,058 if the decline continues.
A close of the daily candlestick below this support would expose a deeper downside level at $55,770.
A sustained rally above the EMA cluster will be required to shift sentiment away from the current bearish bias.