


- Bitcoin’s realized profit/loss ratio fell to -0.35, the lowest level in 43 months since the collapse of FTX in December 2022.
- The probability of Polymarket is 71%. $BTC It will reach $65,000 in July, but the odds of $70,000 are only 24%.
- Longs absorbed $47.91 million in 24-hour liquidations, while shorts absorbed $13.66 million.
Bitcoin fell 1.21% to trade at $62,812.89 on July 6th. While prices are consolidating within an upward channel, on-chain data is flashing the same distress signals that preceded the strong recoveries of 2015, 2019, and 2022.
teeth $BTC Does the ascending channel structure still hold?
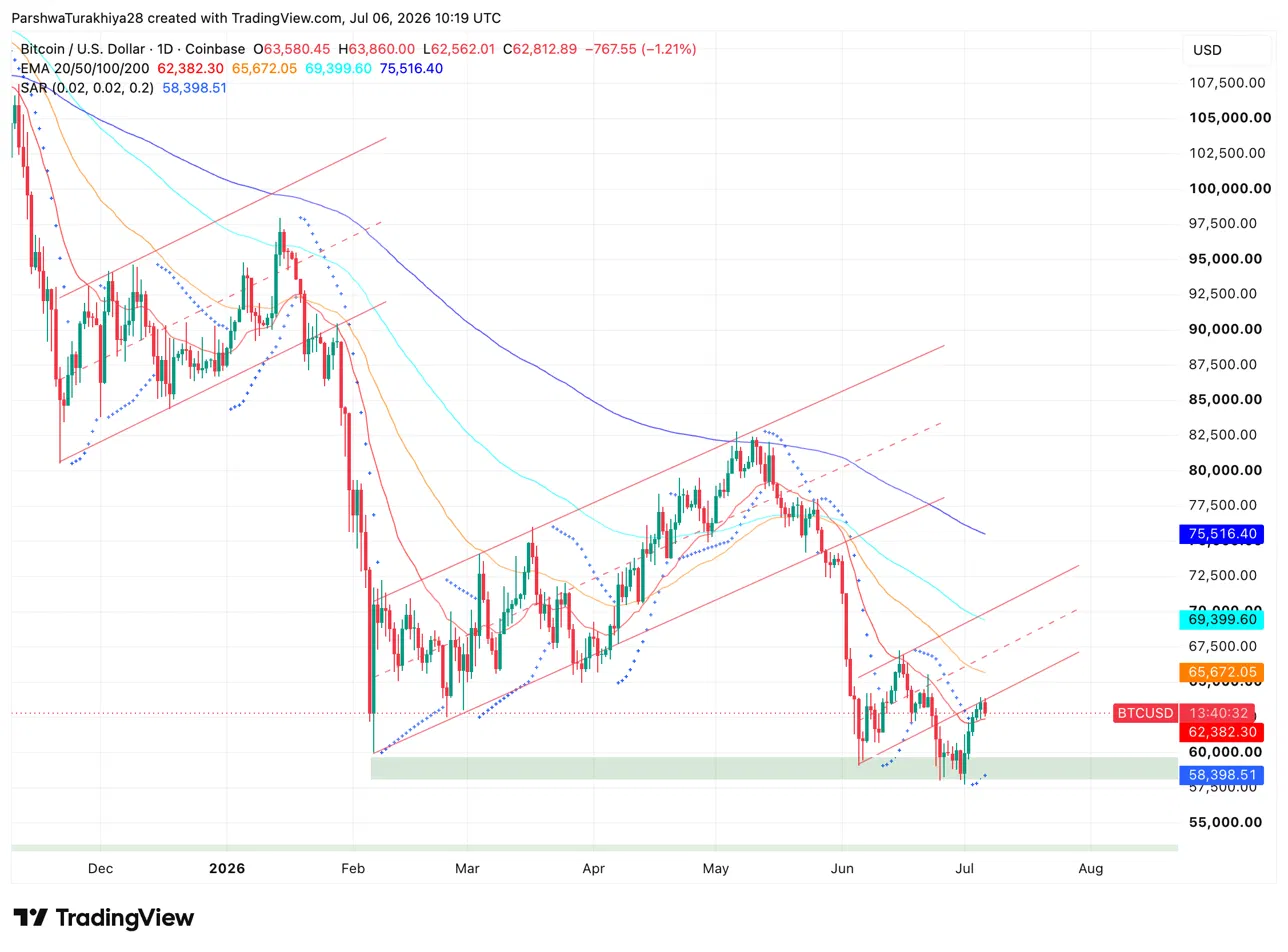
Looking at the daily chart, $BTC It broke out of the ascending channel for the third time in 2026, with the June 25 low around $58,190 being the most recent flash below the lower trend line. Each decline in February and late May of this year was accompanied by a recovery within the channel, and the current bounce from $58,190 is attempting to do the same. Parabolic SAR of $58,398.51 is currently below the price and has turned positive in the short term after reversing during last week’s recovery.
All four EMAs remain above the spot: 20-day at $62,382, 50-day at $65,672, 100-day at $69,399, and 200-day at $75,516. The 20th is essentially the current price and is the first level that bulls need to reclaim and hold in order for the bulls to argue that this breakdown will return to the upside rather than continuing down, like the previous two.
What are the major support and resistance levels $BTC In July?
- Support at SAR lower bounds of $60,000 and $58,398
- 20-day EMA resistance at $62,382 followed by 50-day EMA $65,000 to $65,672
What does Bitcoin’s 43-month P&L minimum actually mean?
🚨 Data: Bitcoin’s realized P&L has hit a 43-month low.
This is a historically low level for major markets. pic.twitter.com/BfhBcBMje7
— Cointelegraph (@Cointelegraph) July 5, 2026
CryptoQuant reported that shortly after FTX’s collapse, Bitcoin’s realized profit/loss ratio fell to -0.35, the lowest since December 2022. $BTC It was trading for less than $16,000. This ratio measures the proportion of Bitcoin’s supply as a percentage of the net profit or loss relative to the total Bitcoin supply. Below -0.35, there will be more supply underwater than at almost any other point in Bitcoin’s history.
The reason this is important is track record. The same reading in December 2022 marked the bottom of the cycle. Similar patterns appeared in 2019 and 2015, but both were preceded by major recoveries rather than further crashes. Matt Hogan, Bitwise’s chief investment officer, said the Strategy preferred stock scandal that triggered the stock’s June 25 crash to $58,190 led to overleveraging and pushed the market closer to the bottom, adding that he expects a new bull run in the fall. Analysts at Swann Bitcoin made a similar argument to buy at current prices instead of waiting for confirmation.
What do prediction markets tell us? $BTCWhat are the prices in July?
Polymarket contract shows cloud pricing $BTCThe results for July are pretty clear. There is a 71% chance that the price will reach $65,000, a 44% chance that the price will reach $67,500, and only a 24% chance that the price will reach $70,000. On the downside, traders see a 38% chance of the stock falling below $57,500 and a 22% chance of falling below $55,000.
This distribution suggests that the market sees a likely trading range for July at $65,000 to $67,500, with significant tail risks on both sides, but clearly leaning toward a gradual recovery rather than another breakdown.
what to do $BTC Derivatives reveal July position?
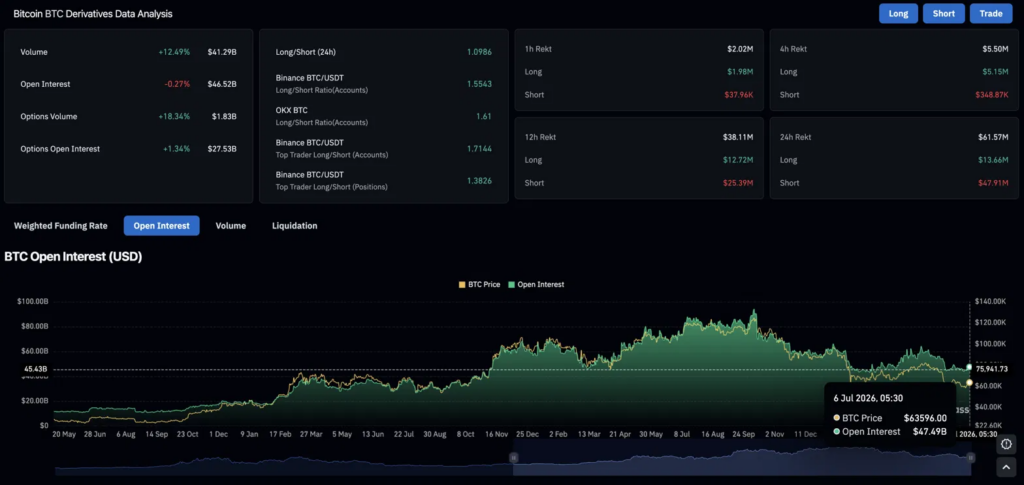
Volume increased by 12.49% to $41.29 billion and open interest decreased by 0.27% to $46.52 billion, a divergence indicating active trading without significant new leverage being added. The long/short ratio is 1.0986, with longs barely outweighing shorts, keeping the market close to neutral.
24-hour liquidations totaled $61.57 million, with longs accounting for the majority at $47.91 million and shorts at $13.66 million, a sign that the July 6 drop caught leveraged buyers off guard. Over a 12-hour period, shorts actually lost significantly by $25.39 million to longs by $12.72 million, suggesting that intraday price movements affected both parties at different points.
Was July a historically strong month for Bitcoin?
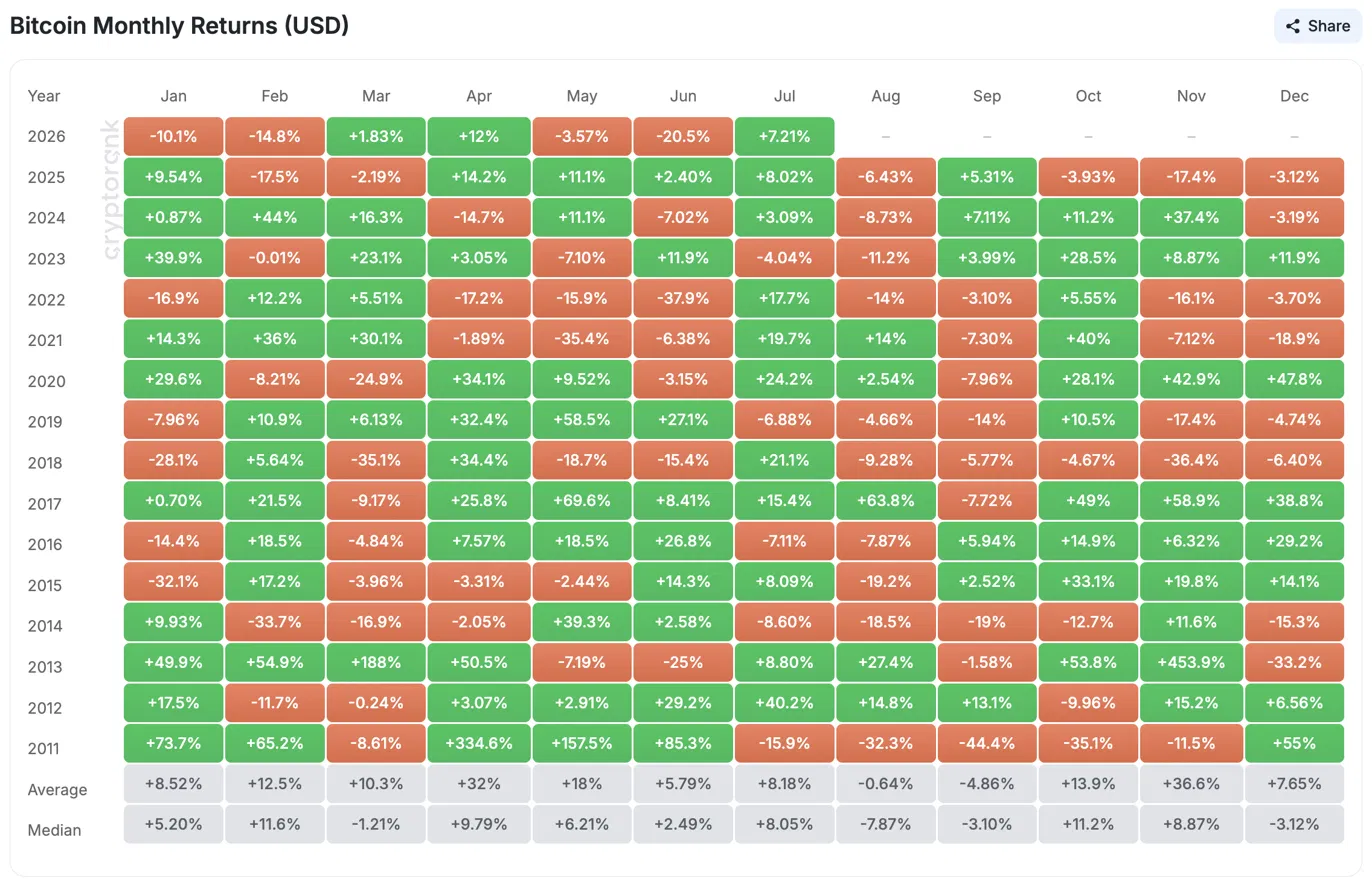
July is definitely one of the more positive months for Bitcoin in history. The average return was 8.18%, the median was 8.05%, and 11 of the last 15 Julys ended in the green. The highest July ever was a 40.2% rise in 2012, and the worst was a 15.9% decline in 2011.
Most recently, July 2025 was up 8.02%, July 2024 was up 3.09%, and after a tough June, July 2022 was up 17.7%. The reading for 2026 has already been recorded at 7.21%, with most of the months still ahead.
Bitcoin Price Prediction: Weekly Prediction for July 2026
Bitcoin price prediction: upside and downside targets
- Turnaround case: The P&L floor signal remains the same as in 2022. $BTC has cleared a 50-day EMA of $65,672, with polymarket odds of 44% against $67,500, with money coming in ahead of the CLARITY Act voting period.
- Downside case: The 20-day EMA of $62,382 rejects the price and longs get squeezed again. $BTC Retest the $58,190 low on the channel floor as the last support before $55,000.


