
Ethereum Price Analysis: What the Charts Are Showing Right Now
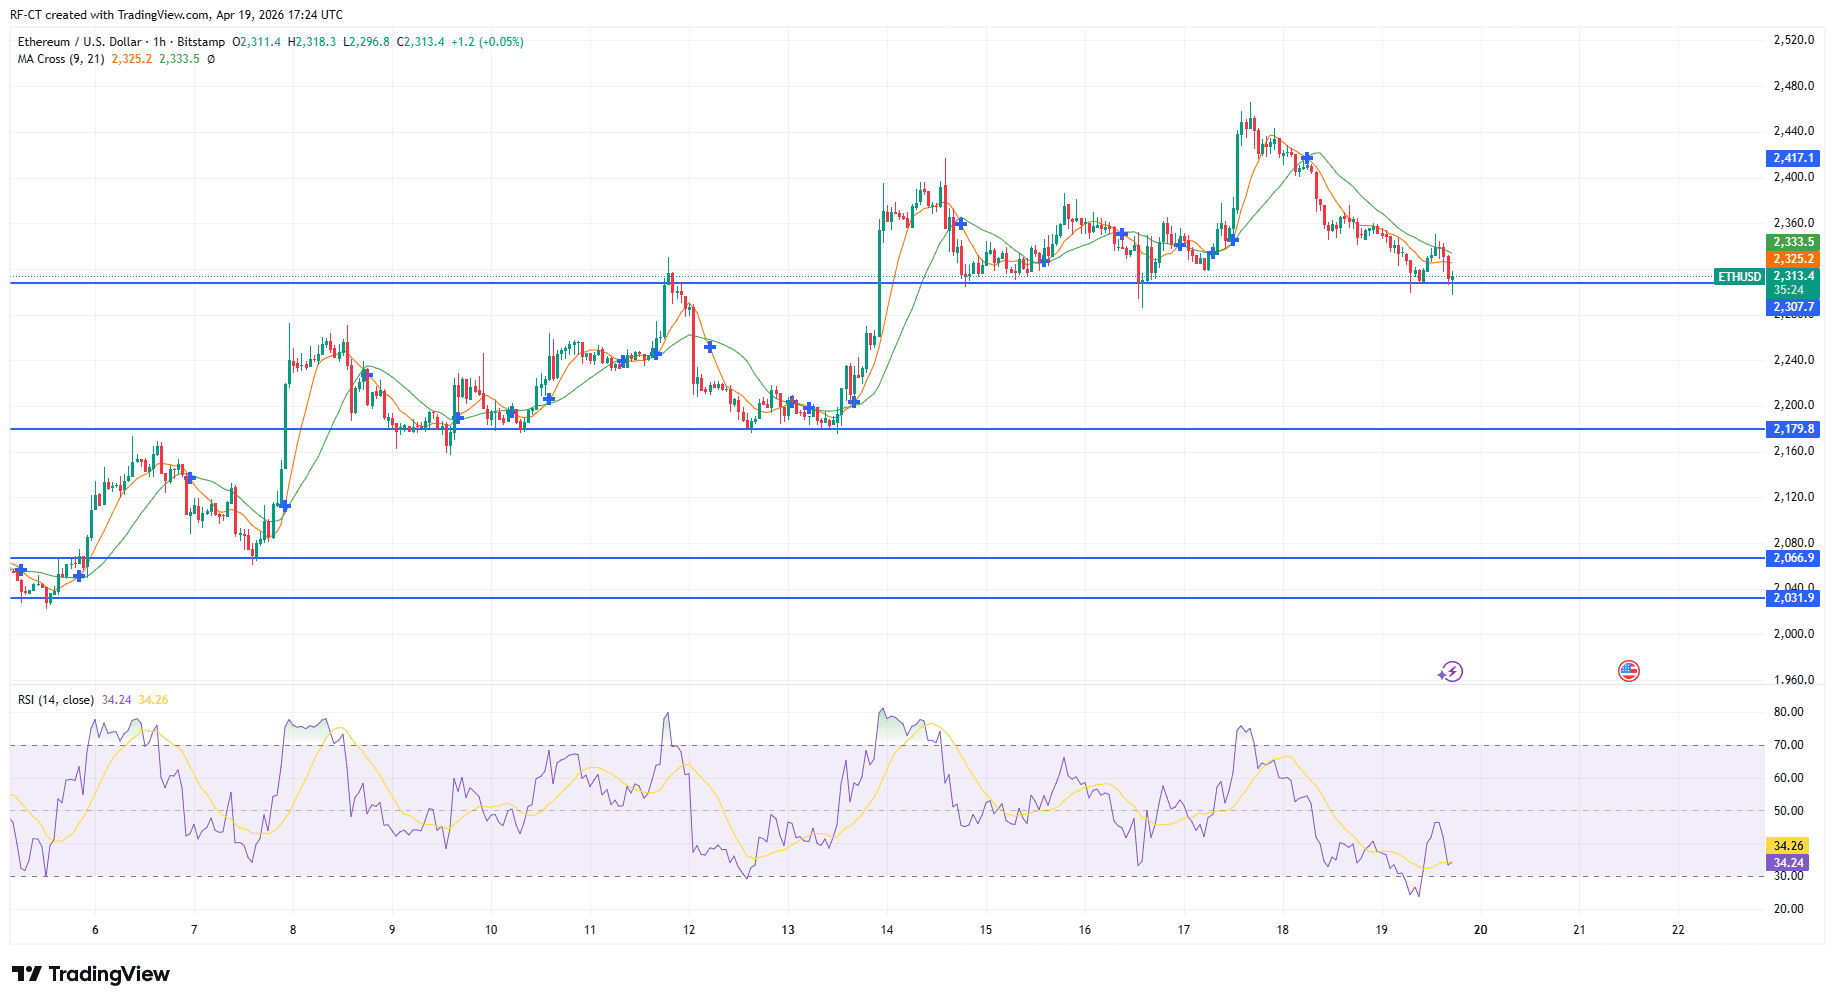
Ethereum is traded mainly on: $2,330 to $2,350 zonesitting directly on a strong support level that has been tested many times. This area clearly acts as a short-term decision point for the market.
The key structure is the tightening between nearby resistance and deeper support.
- resistance exists around $2,417 – $2,450
- Immediate support is on hold until $2,300
- The lower support is $2,179 and $2,066
The recent failure to sustain above $2,400 indicates that the bullish momentum is fading and the price is starting to form. lower high prices In the short term.
Trend breakdown: from breakout to cooling phase
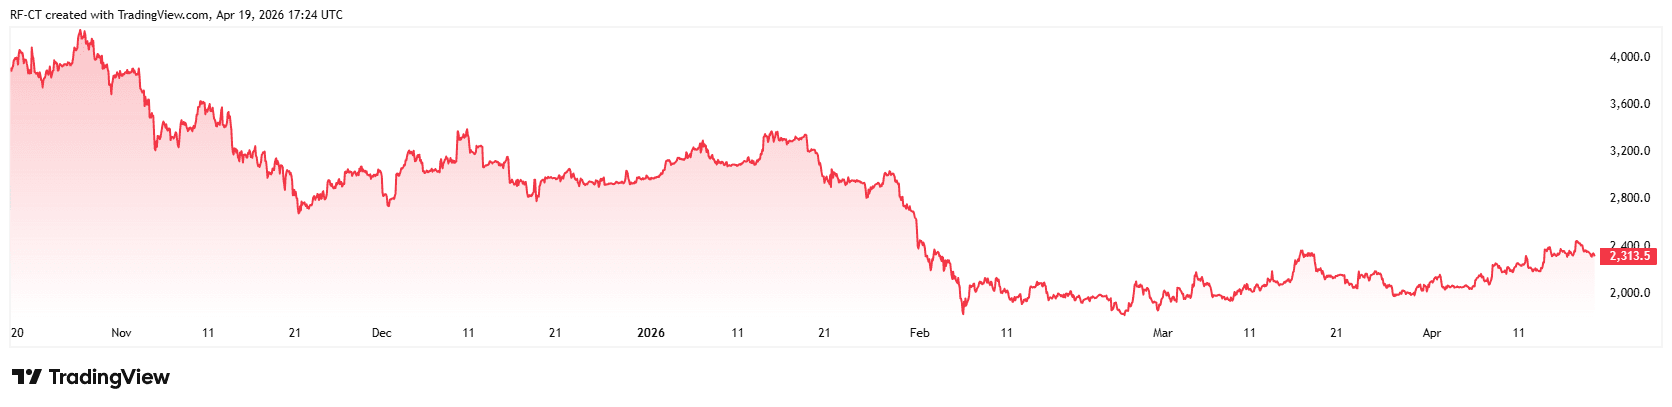
The Ethereum dollar previously soared from around $2,200 to nearly $2,450 in a strong breakout move. However, this rally soon encountered selling pressure on the upside, leading to a gradual slowdown.
Since then, the price has fallen below the short-term moving average and is currently flat. Although this change does not yet confirm a complete reversal of the trend, it clearly indicates that the market has entered a phase. Cooling and solidification stage Rather than a continuation.
RSI signal: There is a rebound, but there is no reversal yet
RSI is currently nearby 34is hovering just above oversold territory. It has recently fallen and is now attempting a slight recovery, which often signals a possible short-term rebound.
Still, the signal remains weak.
- No clear bullish divergence has formed
- Recovery momentum is limited
This suggests that although a rebound is possible, it may not be strong enough to reverse the trend any time soon.
Key levels to focus on
Ethereum is Critical support zone is around $2,300and the reaction here could determine the next move.
If buyers stick to this level, the path to recovery will become clearer.
- First target: $2,360
- after that: $2,417
- Breakout zone: $2,450+
A move above $2,450 will shift momentum back to the bulls, paving the way for an upward move. $2,500.
Conversely, if this support breaks, the decline can accelerate rapidly.
- The first drop is in the direction of $2,179
- then deeper $2,066 – $2,030
Market structure: Transition
The chart reflects a typical post-up structure. $ETH entered the distribution phase after a strong rally and then gradually declined towards support.
This type of structure often leads to decisive movement once compression ends. Currently, the price is caught between maintaining support and breaking down. make or break zone In the short term.
Ethereum price prediction (short-term outlook)
The most likely scenario is $2,300 and $2,400 As the market gains momentum.
- Bullish case: Pending Support → Recover $2,417 → Target $2,450 – $2,500
- Bearish case: $2,300 loss → decline towards $2,180 – $2,060
With volatility currently compressed, a breakout from this range is likely to be sharp.