Ethereum traded at $2,250 on April 30th with the completion of the daily CRT liquidity sweep entering May, its most bullish seasonal month. $ETH The calendar looks ahead, even as spot ETF outflows and the 30-year Treasury yield remaining at 5% complicate the macro picture.
$ETH Daily chart: CRT sweep confirmed, 4 timeframes on discount
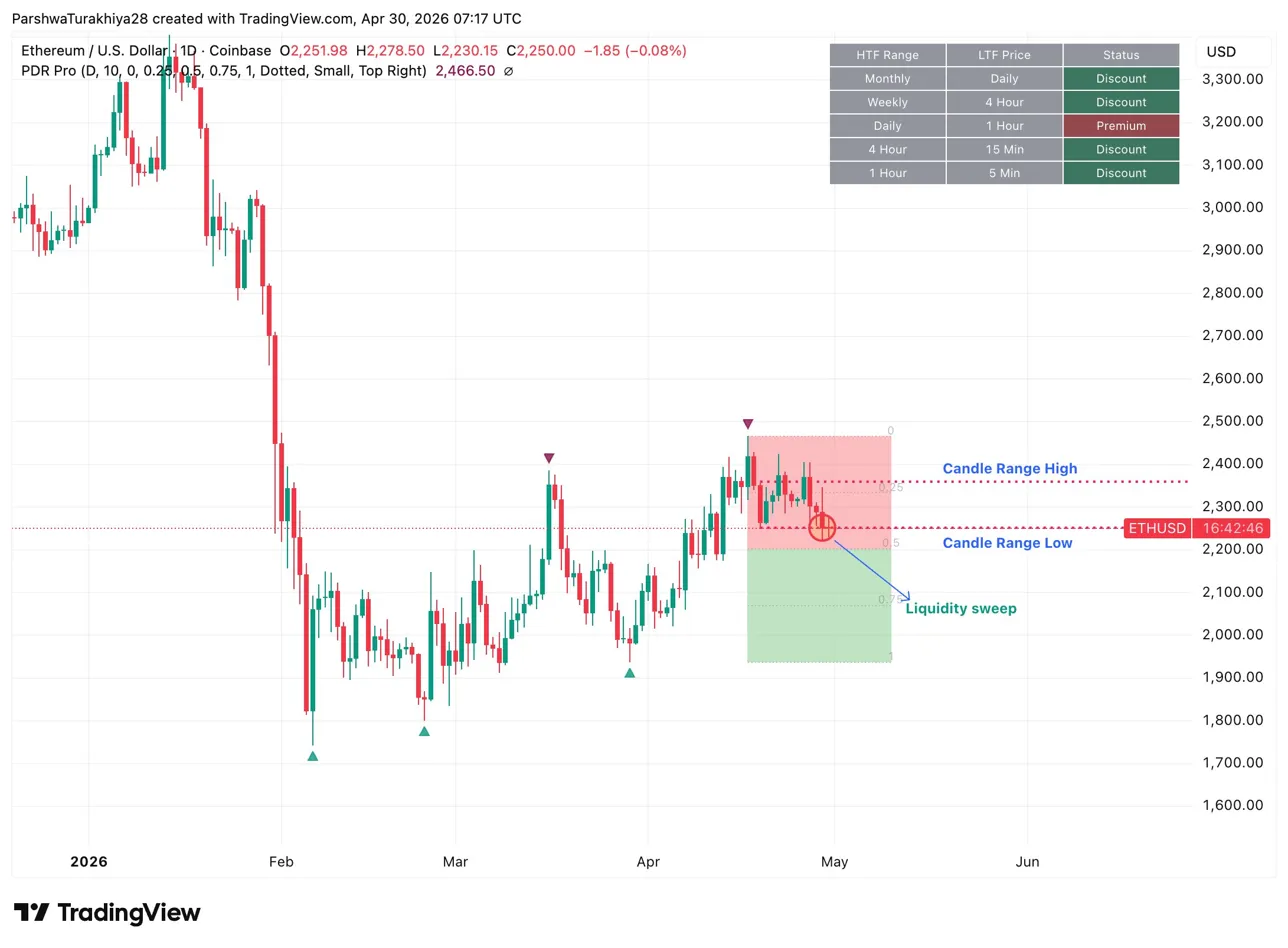
The daily CRT range is from a low of $2,230 to a high of $2,370. After falling below the low of the range, the price returned within the range, confirming the spread of liquidity. The PDR Pro table shows Monthly, Weekly, Daily, and 4 Hours all at a discount, and only 1 Hour at a premium price. 4 out of 5 time frames for discounts mean $ETH It is located in a buy zone compared to all higher time frame ranges.
The price of $2,250 is still below the 0.5 equilibrium of $2,300 and within half of the discount range. The CRT target sequence continues from the $2,300 equilibrium to the $2,370 range high, with a clearing of the range high bringing the PDR pro-value level to $2,466 as the broader target for May.
Main CRT levels for May:
- CRT series low price: $2,230
- Current price: $2,250
- CRT Equilibrium: $2,300
- CRT range top: $2,370
- PDR Pro value level: $2,466
May is $ETHThe strongest month of the year. Here’s what the data shows:
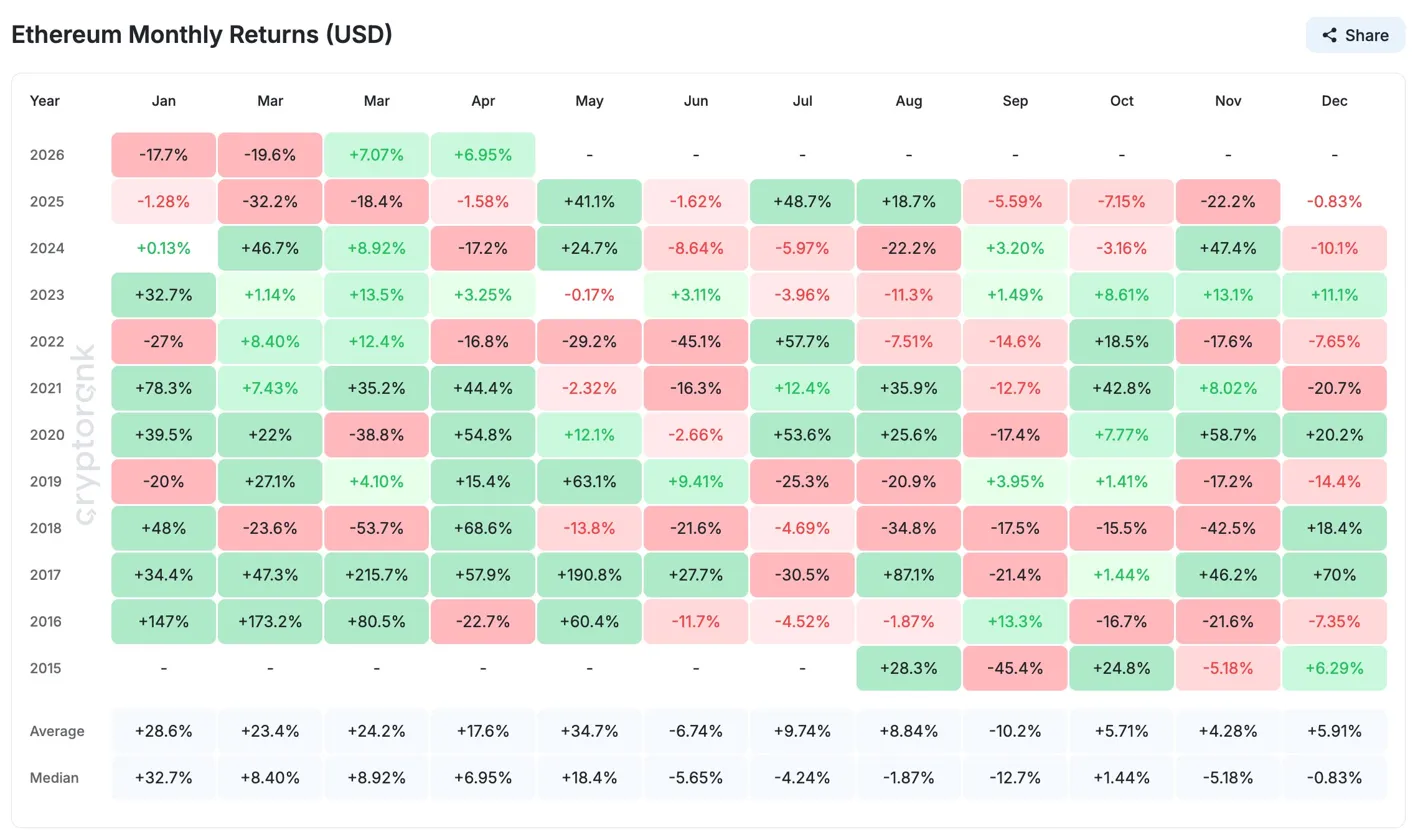
May has an average of 34.7% and a median of 18.4% across all years, the highest average of any calendar month. The May 2025 delivery rate was 41.1%, the May 2024 delivery rate was 24.7%, the May 2019 delivery rate was 63.1%, and the May 2017 delivery rate was 190.8%. The exceptions are -29.2% in May 2022 and -13.8% in May 2018, both during active bear market deleveraging cycles.
Related: Bitcoin price prediction for May 2026: Can BTC break out of the 200-day EMA in May?
$ETH May 2026 starts with two consecutive green months: March at 7.07% and April at 6.95%. This is a quiet foundation-building pattern that preceded the strong move in May in previous cycles. However, macro risks are real. The -29.2% drop in May 2022 came on the back of the Fed’s aggressive rate hikes and sharp rise in yields, a situation very similar to the current setup where the 30-year rate is 5% and three Fed officials are pushing for easing. Seasonality is a tailwind, not a guarantee.
Ethereum May 2026 Price Prediction Table
ETF outflows are a headwind to watch in May
The Ethereum Spot ETF recorded $87.73 million in outflows on April 29, marking the third consecutive day of net outflows and bringing the weekly total to $160 million. BlackRock’s ETHA led the day with $37.06 million, followed by Fidelity’s FETH with $48.37 million.
Cumulative inflows remain positive at $11.94 billion, bringing total net assets to $13.1 billion, but the reversal from the previous week’s $155 million inflows is due to the same macro shift hitting Bitcoin ETFs, not the same macro shift hitting Bitcoin ETFs. $ETH-Specific emotions.
$ETH Derivatives: Longs absorbing the pain of volume spikes
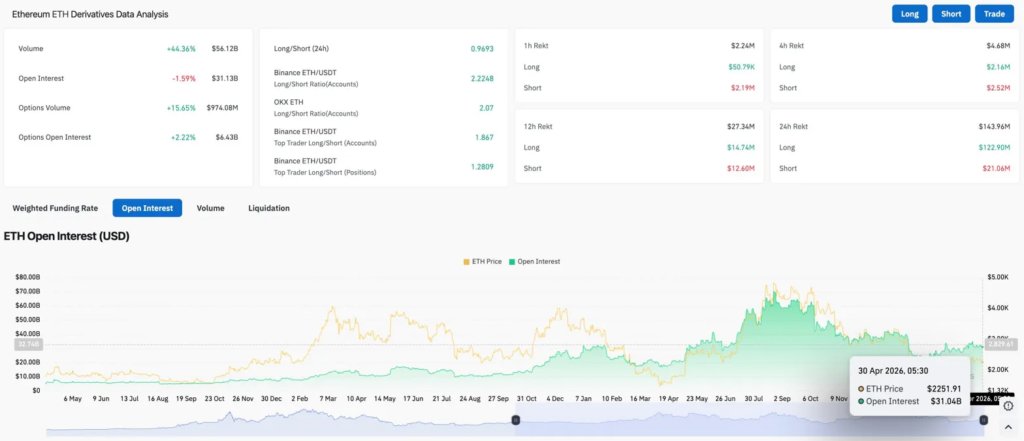
Futures trading volume increased by 44.36% to $56.12 billion, while OI decreased by 1.59% to $31.13 billion, indicating intense liquidity dominated by position closings. Options volume increased 15.65% to $974.08 million, and option OI increased 2.22% to $6.43 billion, hedging positioning rather than directional bets.
The long/short ratio is 0.9693. Top traders on Binance and OKX are both well above 2.07. Longs absorbed $122.9 million in 24-hour liquidation, while shorts took in $21.06 million, giving buyers almost six times the pain. At $31.04 billion, OI is well below its late 2025 peak of around $70 billion, leaving room for leverage and restructuring as May seasonality develops.
$ETH Outlook for May 2026
- Good side: $ETH Keep the CRT range low at $2,230, clear the equilibrium at $2,300, and target $2,370 first. A close above the range high would open at $2,466, and the 200-day EMA from mid-to-late May would open at $2,618. May returns from current price puts averaged 34.7% $ETH By the end of the month, it will be close to $3,030.
- Downside: Below the CRT range low of $2,230, ETF outflows continue into the second week of May, with prices rising towards $2,000. -29.2% for May 2022 is the closest historical analog for the current macro setting. A break below $2,000 will provide deeper support near the February lows of $1,800.